New Special Report: Inflation, How Much is Too Much?
With so much money in the market, coupled with weakened supply chains and workforces due to the fallout of Covid-19, we are seeing a rampant run on inflation. Prices from everything to lumber, oil, and groceries are up. Learn why this is happening, how long it will go on for, and how to protect yourself with this Special Report!
The Markets
Metals - Lackluster Gold Rangebound
Lackluster Gold Rangebound
By: Frank J. Cholly, Senior Market StrategistPosted Jan 7, 2022 8:54AM CT
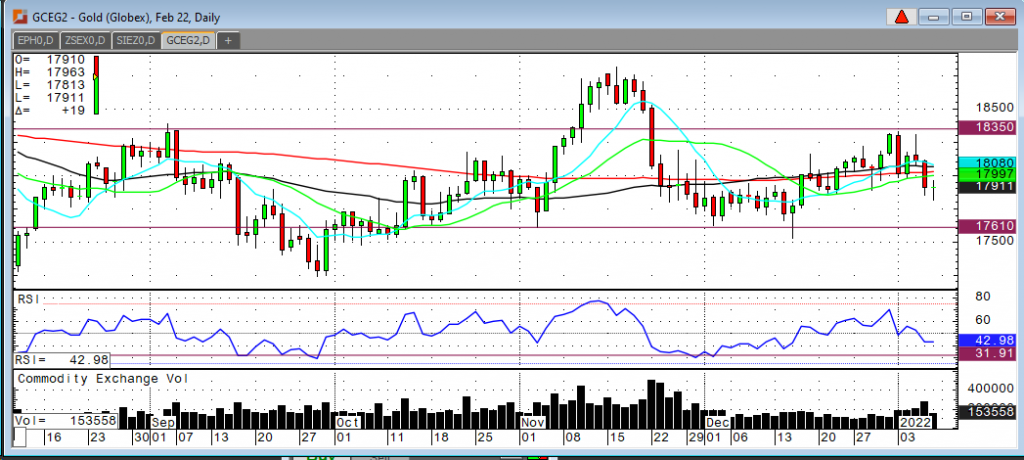
Gold has failed yet again, to break out of this sideways range. The Fed Minutes the other day caused the gold rally to quickly reverse at that $1,835 level…again. This morning’s disappointing jobs number doesn’t seem like enough to lift gold prices back above $1,800, so the path of least resistance remains down. Perhaps back towards $1,770 to $1,760. Gold does seem to have based a bottom in that range. Continue to trade the range from the long side is my best advice. I still think that gold is under valued and will eventually move back above $1,900. Ten year note yields have rallied 25 basis points this week. The Fed has indicated that they will hike rates three times this year. Once gold traders get comfortable with the fact that rates must move higher, due to inflationary pressure, then I think gold can finally move higher also.
Gold Feb '22 Daily Chart If you have any questions or would like to discuss the markets further, please feel free to contact me at 800-826-4124 or fcholly@rjofutures.com. Energy - Oil Headed for Third Straight Weekly Gain
Oil Headed for Third Straight Weekly Gain
By: Alex Turro, Senior Market StrategistPosted Jan 7, 2022 10:09AM CT
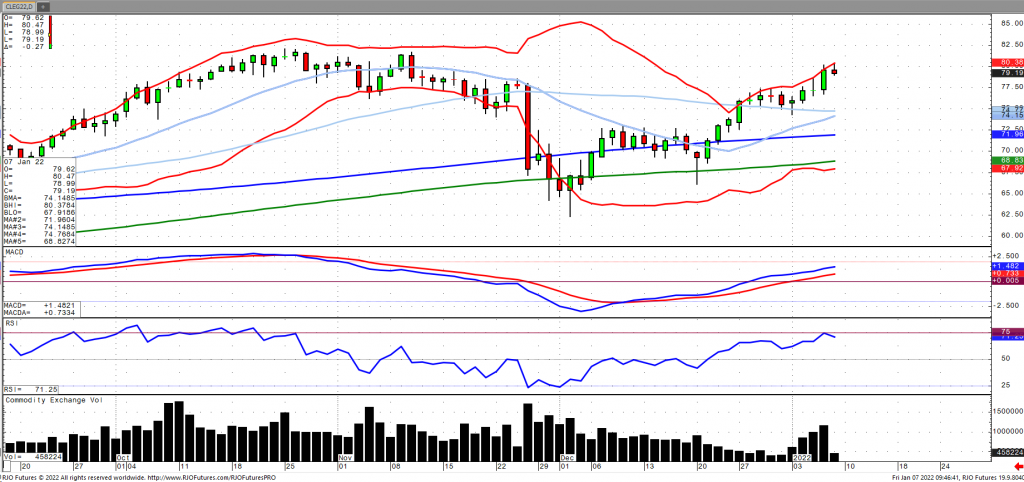
Oil prices are taking a breather early in the session after rising sharply on Thursday amid escalating tensions in Kazakhstan as well as supply outages in Libya and to a smaller extent in Nigeria. Kazakhstan currently produces about 1.6 million barrels of oil per day, although it has not been known that any oil production has been affected. Libya is down about 500k barrels per day due to maintenance and oil field shutdowns. OPEC+ agreed on Tuesday to add 400k barrels of supply in February. Crude stocks fell -2.144 million barrels and falling for the sixth consecutive week totaling -16.169 with gasoline inventories gaining more than 10 million barrels as supplies backed up at refineries, according to the EIA. Oil volatility (ovx) has broken through trend support which comes in the lows 40s as oil has transitioned back to the bullish trend with today’s range seen between 73.71 – 80.42.
Crude Oil Feb '22 Daily Chart If you have any questions or would like to discuss the markets further, please feel free to contact me at 800-438-4805 or aturro@rjofutures.com. Softs - Coffee in Position to Close Higher for the Week
Coffee in Position to Close Higher for the Week
By: Tony Cholly, Senior Market StrategistPosted Jan 7, 2022 9:00AM CT
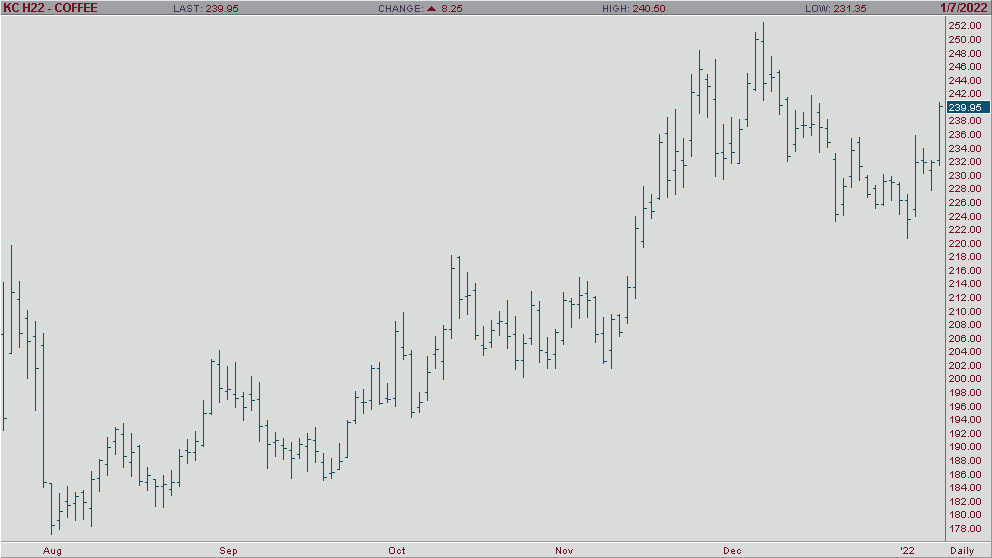
While coffee has only had one positive daily result so far this week, it has been able to avoid a long liquidation washout from this years commodity index fund rebalancing. With the market on track for a positive weekly reversal from Monday's 7-week low, coffee can lift further above the 50-day MA. Global risk sentiment helped to fuel long liquidation, while high levels of new Covid cases in many regions of the world are likely to dampen restaurant and retail consumption.
Momentum studies are trending higher, which should support a move higher if resistance is broken. Support comes in today at 229.50 and 226.30 while resistance comes in at 233.90 and 235.20 for March coffee.
Coffee Mar '22 Daily Chart If you have any questions or would like to discuss the markets further, please feel free to contact me at 800-826-2270 or tcholly@rjofutures.com. Agricultural - Bullish Canola Count Intact Above Minimum 851.5
Bullish Canola Count Intact Above Minimum 851.5
By: RJO Market InsightsPosted 10/14/2022
Posted on Oct 14, 2022, 07:42 by Dave Toth
On
the heels of mid-Sep-to-early-Oct's steeper, accelerated, 3rd-wave-looking
recovery, the past week-and-a-half's boringly lateral chop is first considered
a corrective/consolidative event that warns of a continuation of the uptrend
that preceded it to new highs above 04-Oct's 891.0 high. This count
remains consistent with our broader base/correction/recovery count introduced
in 13-Sep's Technical Blog following that
day's bullish divergence in short-term momentum above 07-Sep's 809.5 minor
corrective high detailed in the hourly chart below.
The
important takeaway from this month's lateral, sleepy price action is the
definition of Wed's 851.5 low as
the end or lower boundary of a suspected 4th-Wave correction. A failure
below 851.5 will confirm a bearish divergence in daily momentum and defer or
threaten a bullish count enough to warrant non-bullish decisions like
long-covers. A failure below 851.5 will not
necessarily negate a broader bullish count, but it will threaten it enough to
warrant defensive measures as the next pertinent technical levels below 851.5 are
13-Sep's prospective minor 1st-Wave high at 813.8 and obviously 08-Sep's 766.0
low. And making non-bullish decisions "down there" is
sub-optimal to say the least. Per such, both short- and longer-term
commercial traders are advised to pare or neutralize bullish exposure on a
failure below 851.5, acknowledging and accepting whipsaw risk- back above 04-Oct's
891.0 high- in exchange for much deeper and sub-optimal nominal risk below
766.0.
On
a broader scale, the daily log scale chart above shows the developing potential
for a bearish divergence in daily momentum that will be considered confirmed
below 851.5. This chart also shows the past month's recovery thus far
stalling in the immediate neighborhood of the (888.0) Fibonacci
minimum 38.2% retrace of Apr-Sep's entire 1128 - 766 decline). COMBINED
with a failure below 851.5, traders
would then need to be concerned with at least a larger-degree correction pf the
past month's rally and possibly a resumption of Apr-Sep's major downtrend.
Until
and unless the market fails below 851.5 however, we would
remind longer-term players of the key elements on which our bullish count is
predicated:
a confirmed bullish divergence in WEEKLY momentum
(below)
amidst
an
historically low 11% reading in out RJO Bullish Sentiment Index and
a
textbook complete and major 5-wave Elliott sequence down from 29-Apr's
1128 high to 08-Sep's 766.0 low.
Thus
far, the market is only a month into correcting a 4-MONTH, 32% drawdown, so
further and possibly protracted gains remain well within the bounds of a major
(suspected 2nd-Wave) correction of Apr-Sep's decline within an even more
massive PEAK/reversal process from 17-May's 1219 high on an active continuation
basis below.
These
issues considered, a bullish policy and exposure remain advised with a failure
below 851.5 required to defer or threaten this call enough to warrant moving to
a neutral/sideline position. In lieu of such weakness, we anticipate a
continuation of the past month's rally to new highs and potentially significant
gains above 891.0.
Agricultural - Grains - Consolidation on the Daily Chart
Grains - Consolidation on the Daily Chart
By: Michael Sabo, Senior Market StrategistPosted Jan 7, 2022 10:56AM CT
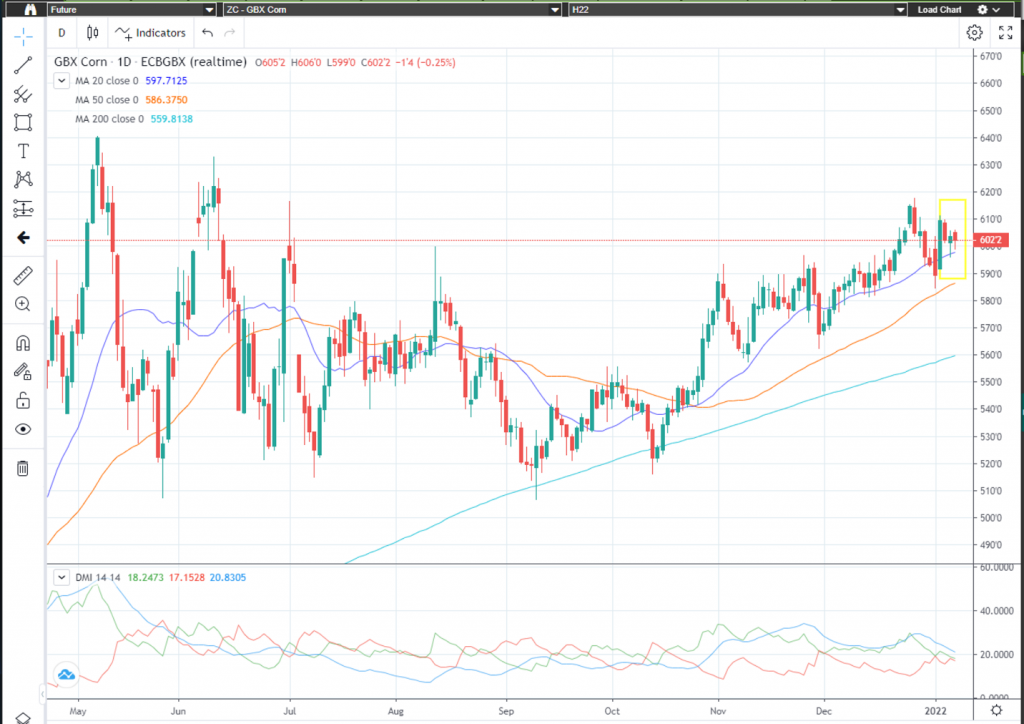
n December 17th I advised traders “March corn continues to push higher and at the time of this writing it has hit a daily high of $5.98 3/4. Traders should watch for the breakout above $6.01 ½ . Yesterday March Corn had an inside day which appears to have been a nice setup since the market is breaking higher today. Watch for the major breakout above $6.01 ½”.On December 22nd March corn broke above $6.01 ½ and went on to make a high of $6.17 ¾ before backing off. Today, I would advise traders to watch for another breakout (see yellow highlighted box below). I believe short term aggressive levels are $6.11 ¾ on the upside, $5.89 ¾ on the downside, and the medium term breakout levels are $6.18 ½ upside and $5.83 ½ on the downside.
The “big picture” numbers remain the same and probably will for some time. I firmly believe a break below $4.96 could give the bears control of the market and a break above $6.39 ½ on the upside may have enough bulls behind it to propel corn to all-time highs. There are several minor areas of support and resistance inside this range that can help with short term market direction if violated. Call me directly at 1-800-367-7290 for more in-depth discussion on these numbers and to discuss trading strategies specific to your situation.
I would suggest using an option strategy to manage your futures position risk or an outright option strategy. Implied option volatility has come down quite a bit from its most recent highs mainly due to the consolidation and tighter trading ranges. I have 25-years of grain market experience, feel free to call or email with any questions you may have. Be sure to check out my archived weekly grain market insight articles posted on our website.
**** Reserve
your FREE 2022 Commodity Trading Guide Today! ****
This 55-page guide is packed with indispensable market information. It has a complete commodity calendar that lists the dates and times of Market Reports, option expiration dates, futures first notice dates, futures last trade dates, etc. It readily serves as your commodity market encyclopedia giving you an in depth look at each commodity, there is market almanac for all actively traded commodities and much more! To reserve your complimentary Commodity Trading Guide, send me an email at msabo@rjofutures.com with the following information: your full name, mailing address and a preferred phone number so we can confirm your request. Once confirmed, I will reserve your trading guide, and have it sent out as soon as we receive them.
Corn Daily Chart If you have any questions or would like to discuss the markets further, please feel free to contact me at 800-367-7290 or msabo@rjofutures.com. Interest Rates - Interest Rates Moving on Hawkish FOMC
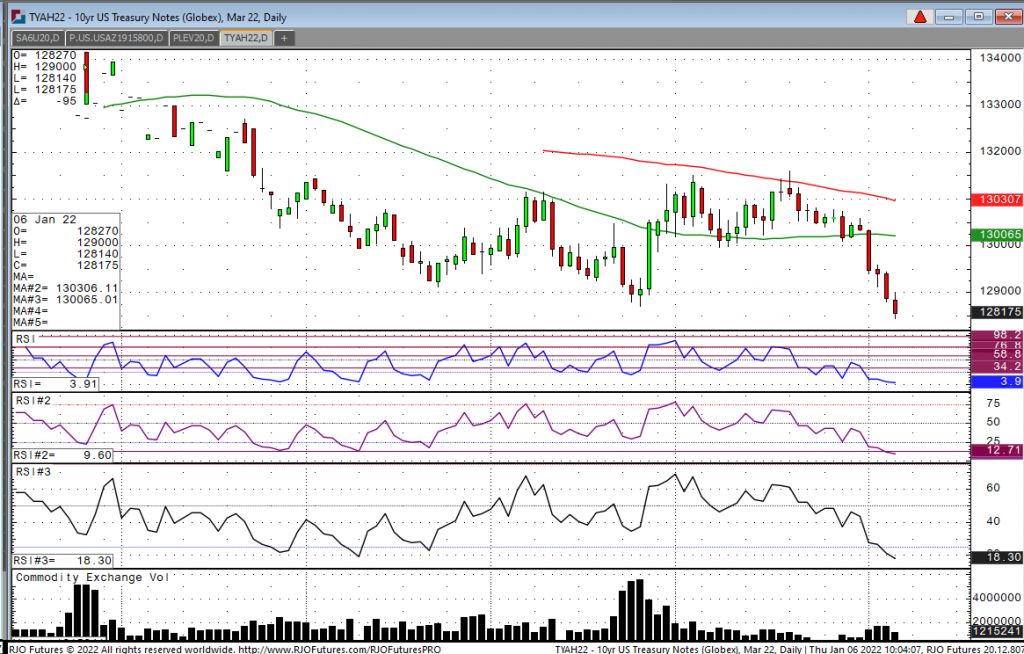
Looking at the March 10-year note, we had an overnight high of 129-00, a low of 128-14, and currently we are trading at 128-19. Overnight we saw the yield reach the highest we have seen since last March, 1.75% and lowest in price at 128-14. The big move we saw yesterday was in response to the FOMC minutes where fed governors were extremely hawkish(bearish) and reiterated their belief that we will see at least two rate hikes in 2022 and stressed continued concern regarding inflation. In addition to the big down moves yesterday we saw across the cure in treasuries, the Nasdaq composite was hit extremely hard, and it is highly correlated in moves in rates. Presently, the 10-year has stabilized a bit which is also leading to a rise in the technology sector. As stated earlier, seeing the note hit 1.75 % overnight is a psychological level where we might stabilize and it wouldn’t take much to come down a bit, especially if Powell or Fed governors come on tape and say anything that might be construed as dovish.
10-Year Mar '22 Daily Chart If you have any questions or would like to discuss the markets further, please feel free to contact me at 800-826-2270 or gperlin@rjofutures.com. Equity - Economy Adds 199K Jobs in December
Economy Adds 199K Jobs in December
By: Bill Dixon, Senior Market StrategistPosted Jan 7, 2022 10:05AM CT
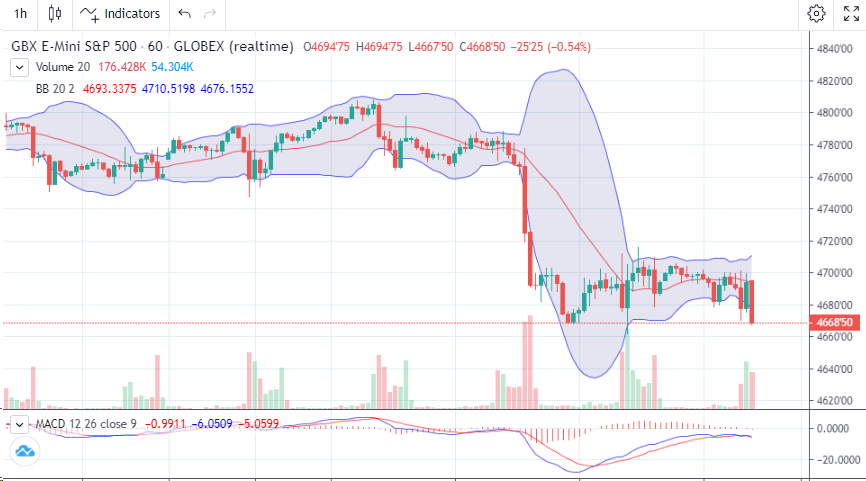
While the unemployment rate dropped to 3.9%, the headline
number came in well below the 425k jobs we were anticipating. Labor force participation held steady at
61.9%. This news follows a hawkish Fed
minutes release on Wednesday that suggests we could see a hike in interest
rates as soon as March. Market response was
pretty muted following the news, with the three major indices holding steadily
near unchanged in the wake of the number, but they have since started to dip.
The Fed minutes from the December’s meeting indicated that most Fed officials thought we were close to reaching or had already achieved full employment, which Powell has consistently stated was a prerequisite to rate hikes. Seeing the unemployment rate dip below 4.0% can only help firm up their stance. With inflation now being viewed as something that is here to stay rather than the retired “transitory,” the Fed would like to end its bond buying program and start to normalize interest rates.
E-mini S&P 500 Daily Chart If you have any questions or would like to discuss the markets further, please feel free to contact me at 800-669-5354 or bdixon@rjofutures.com. Economy - S-T Mo Failure Insufficient to End RBOB Correction, But Beware
S-T Mo Failure Insufficient to End RBOB Correction, But Beware
By: RJO Market InsightsPosted 11/08/2022
Posted on Nov 08, 2022, 07:51 by Dave Toth
In Fri's Technical Webcast we identified a
minor corrective low at 2.6328 from Thur as a mini risk parameter the market
needed to sustain gains above to maintain a more immediate bullish count.
The 240-min chart below shows the market's failure overnight below this level,
confirming a bearish divergence in very short-term momentum. This mo
failure defines Fri's 2.8172 high as
one of developing importance and a parameter from which very short-term traders
can objectively base non-bullish decisions like long-covers.
Given
the magnitude of the past three weeks' broader recovery however, this
short-term momentum failure is of an insufficient scale to conclude anything
more than another correction within this broader recovery from 26-Sep's 2.1877
low. Indeed, overnights failure below 2.6328 only allows us to conclude
the end of the portion of the month-and-a-half rally from 31-Oct's 2.4822 next
larger-degree corrective low. 2.4822 is the
risk parameter this market still needs to fail below to break the uptrend from
18-Oct's 2.3526 low while this 2.3526 low
remains intact as the risk parameter this market needs to fail below to break
the month-and-a-half uptrend. From an
intermediate-to-longer-term perspective, this week's setback falls well within
the bounds of another correction ahead of further gains. This is another
excellent example of the importance of technical and trading SCALE and
understanding and matching directional risk exposure to one's personal risk
profile.
The
reason overnight's admittedly minor mo failure might have longer-term
importance is the 2.8172-area from which it stemmed. In
Fri's Technical Blog we also noted the market's engagement of the
2.8076-to-2.8159-area marked by the 61.8% retrace of Jun0-Sewp's 3.2758 -2.1877
decline and the 1.000 progression of Sep-Oct's initial 2.1877 - 2.6185
(suspected a-Wave) rally from 18-Oct's 2.3526 (suspected b-Wave) low. We
remind longer-term players that because of the unique and compelling confluence
of:
early-Aug's bearish divergence in WEEKLY momentum
amidst
historically
extreme bullish sentiment/contrary opinion levels in our RJO Bullish
Sentiment Index
an
arguably complete and massive 5-wave Elliott sequence from Mar'20's 0.4605
low to Jun's 4.3260 high (as labeled in the weekly log active-continuation
chart below) and
the
5-wave impulsive sub-division of Jun-Sep's (suspected initial 1st-Wave) decline
The
recovery attempt from 26-Sep's 2.1877 low is arguably only a 3-wave (Wave-2)
corrective rebuttal to Jun-Sep's decline within a massive, multi-quarter
PEAK/reversal process. Now granted, due to the magnitude of 2020 -2022's
secular bull market, we discussed the prospect for this (2nd-Wave corrective)
recovery to be "extensive" in terms of both price and time. A
"more extensive" correction is typified by a retracement of 61.8% or
more and spanning weeks or even months following a 3-month decline. Per
such, the (suspected corrective) recovery from 26-Sep's 2.1877 low could easily
have further to go, with commensurately larger-degree weakness than that
exhibited this week (i.e., a failure below at least 2.4822) required
to consider the correction complete. Indeed, the daily log chart above
shows the market thus far respecting former 2.6185-area resistance from 10-Oct
as a new support candidate.
These
issues considered, very shorter-term traders have been advised to move to a neutral/sideline
position following overnight's momentum failure below 2.6328, with a recovery
above 2.8172 required to negate this call, reaffirm the recovery and re-expose
potentially significant gains thereafter. For intermediate- and
longer-term players, a bullish policy and exposure remain advised with a
failure below 2.4822 required to threaten this call enough to warrant
neutralizing exposure. We will be watchful for another bearish divergence
in momentum following a recovery attempt that falls short of Fri's 2.8172 high
that would be considered the next reinforcing factor to a count calling that
2.8172 high the prospective end to the month-and-a-half 2nd-Wave
correction. In lieu of such, a resumption of the current rally to
eventual new highs above 2.8172 should not surprise.