Do you have what it takes to be an RJO Echo Leader?
If you are a successful trader, consider becoming an Echo Leader to share your influence and trades on the RJO Echo Trading platform and get compensated for your trading prowess. You can trade either an automated trading strategy or discretionary strategy. You choose the monthly rate for access to your trades and then simply begin trading.
RJO Futures PRO Trading Platform
FREE 100k Simulated Trading Account
Experience a trading platform like no other with integrated tools to seamlessly trade and monitor the markets. With a free simulated trading account and personal broker experience, we’ll teach you about futures trading and help you develop a trading strategy.
The Markets
Metals - Has Gold Lost Its Safe-Haven
Has Gold Lost Its Safe-Haven
By: Nicholas DeGeorgePosted 06/05/2020
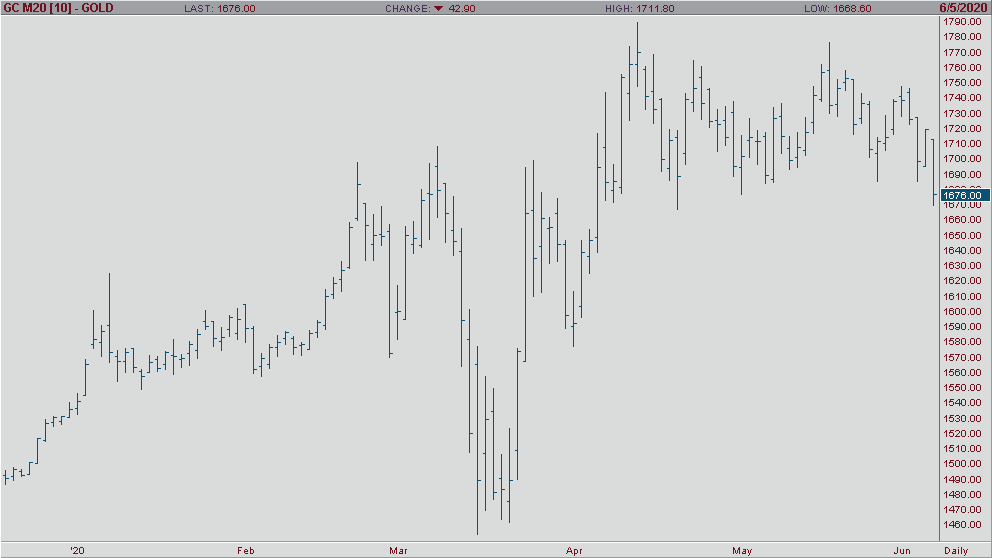
In the early morning trade after better than expected May non-farm payroll number this morning with a reading of 13.3%, gold has sold-off more than $40 an ounce and currently trading at $1681.0. The payroll number was supposed to come in over 19%, so this was seen as a big positive in the big V-shape recovery we are having despite all the recent chaos in this country over the past few months. After this week’s trading and today’s job report, gold has lost some of its safe-haven buying as it broke new weekly lows this morning. Poor global weekly reports and with the EU announcing a 1.3 trillion-euro stimulus package, gold has not been able to get a bounce to hold onto yesterday’s gains hinting the COVID-19 rally could be losing its steam. Look for support in gold roughly between $1670-$1650 or a breakout above yesterday’s high of $1729 an ounce.
Gold Jun '20 Daily ChartMetals - Silver Chart Showing Weakness
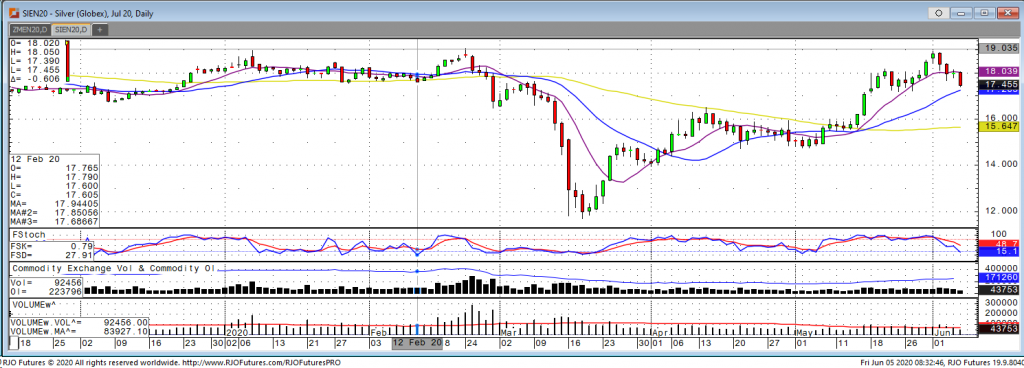
The North American session has begun with the weekly initial jobless claims which showed the U.S. added 2.5 million jobs in May against expectations of losing over 8 million. While the silver market may not be shedding its gains as much as gold, the charts are showing some weakness after a rally last week. Although traders were not presumably expecting to see data reflecting jobs returning faster than expected, its difficult to fully grasp the extent of pain that’s still present within the labor market. We would like to see metals such as gold and silver sustain yesterday’s recovery move, when the central banks like the ECB step forward with a 1.3 trillion stimulus package.
July silver may see a failure of $17.50, with the possibility of the session testing $17.20 if this occurs. Seeing as there has been a glimmer of hope from recent economic data, this is to be expected. July silver needed a pullback in order to potentially test resistance of $18.00.
Silver Jul '20 Daily Chart If you have any questions or would like to discuss the markets further, please feel free to contact me at 800-826-2270 or therrmann@rjofutures.com. Energy - Oil Extends Gains on Jobs
Oil Extends Gains on Jobs
By: Alex Turro, Senior Market StrategistPosted Jun 5, 2020 9:16AM CT
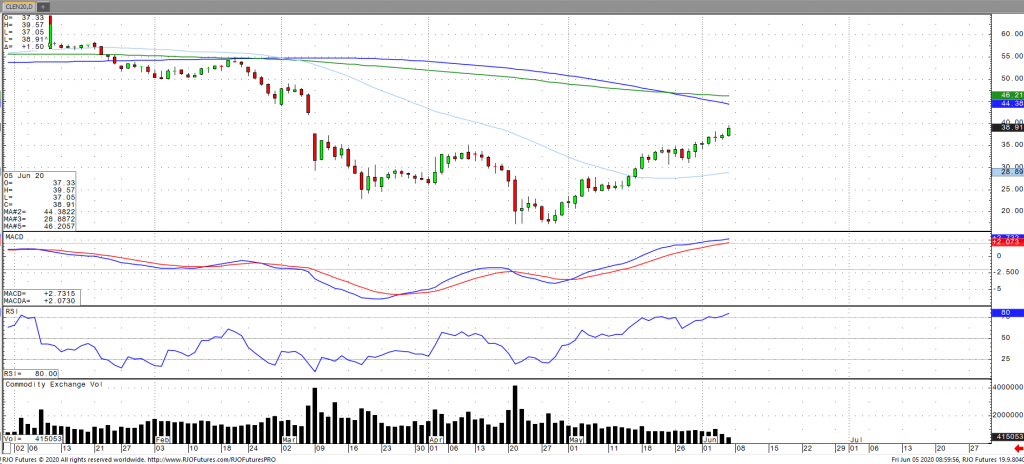
Oil rose to a three-month high ahead of the upcoming OPEC meeting amid data showing the economy defied expectations and added jobs in May. The OPEC plus meeting was expected to be canceled next week due to non-compliance by Iraq, however, it would appear that the meeting will take place this weekend with Russia indicating that it would not attend unless an agreement would be set. An extension of cuts with full compliance would include a removal of over 7 million to upwards of 9.7 million barrels per day. However, following July OPEC plus supply cut will be reduced by 2 million barrels a day and therefore you will need to see an increase in demand to offset return of supply as WTI approaches $40 a barrel. Notwithstanding, oil vol (OVX) remains highly elevated and the market bearish trend with today’s range seen between 30.66 – 38.67.
Crude Oil Jul '20 Daily Chart If you have any questions or would like to discuss the markets further, please feel free to contact me at 800-438-4805 or aturro@rjofutures.com. Softs - Lack of Demand During Pandemic Continues to Lead Cocoa Trade
Lack of Demand During Pandemic Continues to Lead Cocoa Trade
By: Peter MoosesPosted 06/04/2020
Economically, the world is in an overall slowdown. People
aren’t spending money on non-essential items for the most part, weighing on
chocolate sales. The demand of cocoa is down, if consumers aren’t spending
money on chocolate due to covid-19 restrictions, this will only pull cocoa
prices lower than before the pandemic when demand was already a concern. Supply
concerns continue to provide support though, mainly due to output concerns and
bearish weather patterns.
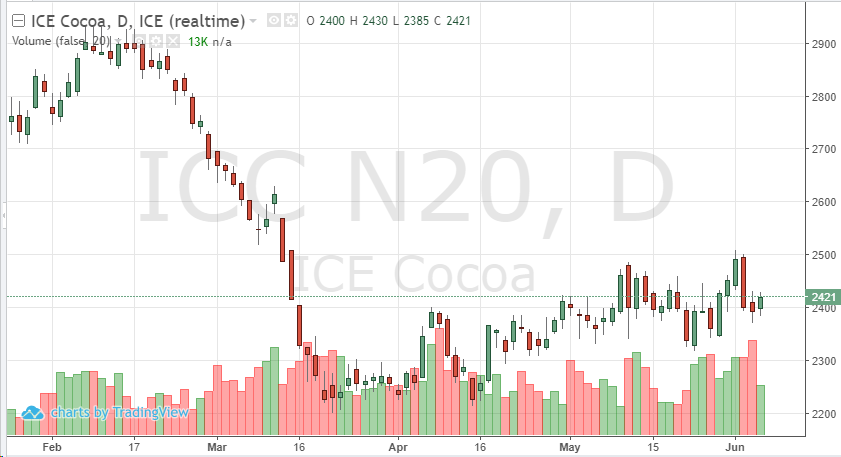
The equity markets have rallied, but commodities haven’t followed, especially in the softs. With so many uncertainties remaining and lack of economic growth which is needed for people to feel comfortable to start spending money on luxuries and not just on necessities, cocoa futures could stay in the 2350-2500 range for the summer months. If another wave of coronavirus occurs globally, look for commodities like cocoa to take another hit lower – prices we saw in March will be tested.
Cocoa Jul '20 Daily ChartSofts - Coffee Prices Continued Weakness
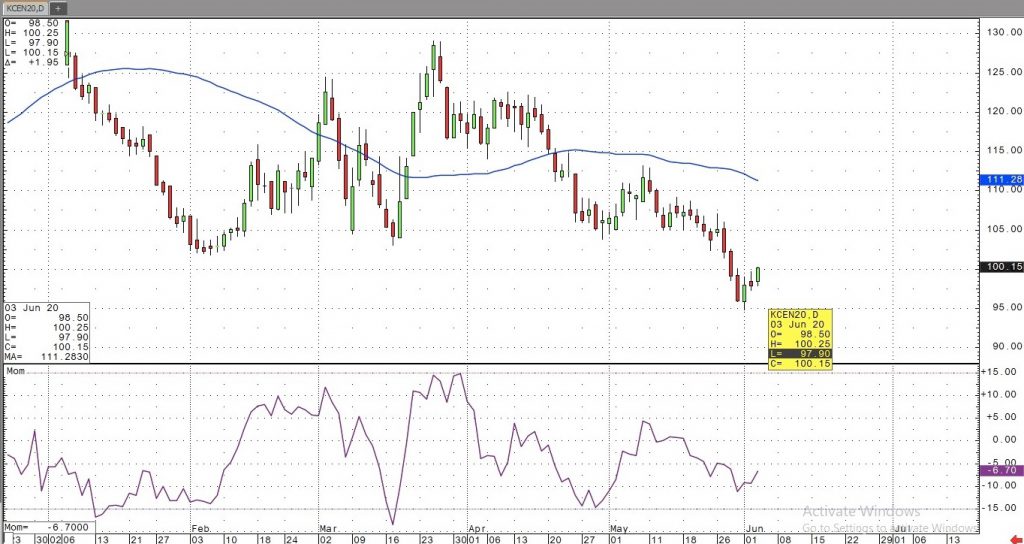
Coffee Prices Continued Weakness
By: Adam TuiaanaPosted 06/03/2020
The coffee market has been able to gauge the level
of return demand from the fast-paced re-opening of the world economy, and it
has been a rough start back to say the least. July coffee prices took a dive to
violate the 100 level, which should have been a good support area. Although
many factors should have been able to support higher coffee prices, we have
only seen weakness. Some demand has returned to coffee with the re-opening of
the economy, but it has not been nearly enough to offset the upcoming large
Brazilian crop that will ultimately need to find a home. Major factors such as
continued strength to record highs in the US stock market, a weaker US Dollar
and strong Brazilian currency have still not been able to lend support to
coffee prices. We should expect to see the same until all restaurant businesses
on this planet return to full steam to fill the massive void left unsatisfied
by “home demand”.
On the technical side, the violation of the 100
level in July coffee prices should signal a continued move lower, and 100 now
becomes our new resistance area. Rather than trying to call a bottom on this
market, traders should be advised to follow the trend at this point.
On
the heels of mid-Sep-to-early-Oct's steeper, accelerated, 3rd-wave-looking
recovery, the past week-and-a-half's boringly lateral chop is first considered
a corrective/consolidative event that warns of a continuation of the uptrend
that preceded it to new highs above 04-Oct's 891.0 high. This count
remains consistent with our broader base/correction/recovery count introduced
in 13-Sep's Technical Blog following that
day's bullish divergence in short-term momentum above 07-Sep's 809.5 minor
corrective high detailed in the hourly chart below.
The
important takeaway from this month's lateral, sleepy price action is the
definition of Wed's 851.5 low as
the end or lower boundary of a suspected 4th-Wave correction. A failure
below 851.5 will confirm a bearish divergence in daily momentum and defer or
threaten a bullish count enough to warrant non-bullish decisions like
long-covers. A failure below 851.5 will not
necessarily negate a broader bullish count, but it will threaten it enough to
warrant defensive measures as the next pertinent technical levels below 851.5 are
13-Sep's prospective minor 1st-Wave high at 813.8 and obviously 08-Sep's 766.0
low. And making non-bullish decisions "down there" is
sub-optimal to say the least. Per such, both short- and longer-term
commercial traders are advised to pare or neutralize bullish exposure on a
failure below 851.5, acknowledging and accepting whipsaw risk- back above 04-Oct's
891.0 high- in exchange for much deeper and sub-optimal nominal risk below
766.0.
On
a broader scale, the daily log scale chart above shows the developing potential
for a bearish divergence in daily momentum that will be considered confirmed
below 851.5. This chart also shows the past month's recovery thus far
stalling in the immediate neighborhood of the (888.0) Fibonacci
minimum 38.2% retrace of Apr-Sep's entire 1128 - 766 decline). COMBINED
with a failure below 851.5, traders
would then need to be concerned with at least a larger-degree correction pf the
past month's rally and possibly a resumption of Apr-Sep's major downtrend.
Until
and unless the market fails below 851.5 however, we would
remind longer-term players of the key elements on which our bullish count is
predicated:
a confirmed bullish divergence in WEEKLY momentum
(below)
amidst
an
historically low 11% reading in out RJO Bullish Sentiment Index and
a
textbook complete and major 5-wave Elliott sequence down from 29-Apr's
1128 high to 08-Sep's 766.0 low.
Thus
far, the market is only a month into correcting a 4-MONTH, 32% drawdown, so
further and possibly protracted gains remain well within the bounds of a major
(suspected 2nd-Wave) correction of Apr-Sep's decline within an even more
massive PEAK/reversal process from 17-May's 1219 high on an active continuation
basis below.
These
issues considered, a bullish policy and exposure remain advised with a failure
below 851.5 required to defer or threaten this call enough to warrant moving to
a neutral/sideline position. In lieu of such weakness, we anticipate a
continuation of the past month's rally to new highs and potentially significant
gains above 891.0.
Agricultural - Grain Futures Update w/Stephen Davis - 06/04/2020
Grain Futures Update w/Stephen Davis - 06/04/2020
By: Stephen DavisPosted 06/04/2020
Stephen Davis discusses this week's movements in the grain markets. With Brazil's supply of soybeans nearly depleted we may see a spike in the sale of U.S. new crop soybeans.Currency - King US Dollar Grows Old
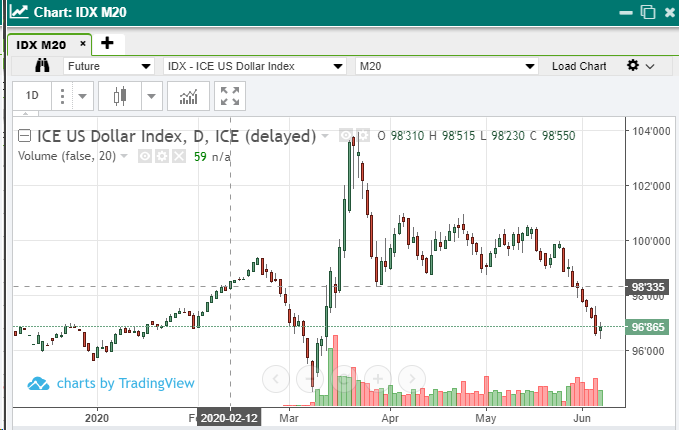
King US Dollar Grows Old
By: Ian BannonPosted 06/05/2020
June US dollar futures are trading slightly higher on Friday morning for the first time in seven sessions. The safe-haven qualities of the USD have gone to the wayside as successful economic openings become headline news, and the “do-whatever-it-takes” policy of the Fed begins to weaken the world’s reserve currency. A rise in rates is helping to support the greenback near 96.80 this morning. The longer-term theme hasn’t changed, and foreign currencies are beginning to tell that story. The euro blasted higher this week, trading along 1.1335 Friday morning after a breakout from 1.10. The currency of the EU is likely to show the most relative strength if the dollar continues to weaken. Commodity currencies, like the Aussie and Canadian dollar, have done well as the price of oil rebounds to the $40 level. There is a paradigm shift happening in the currency space right now, and the days of “King Dollar” may be in the rearview mirror.
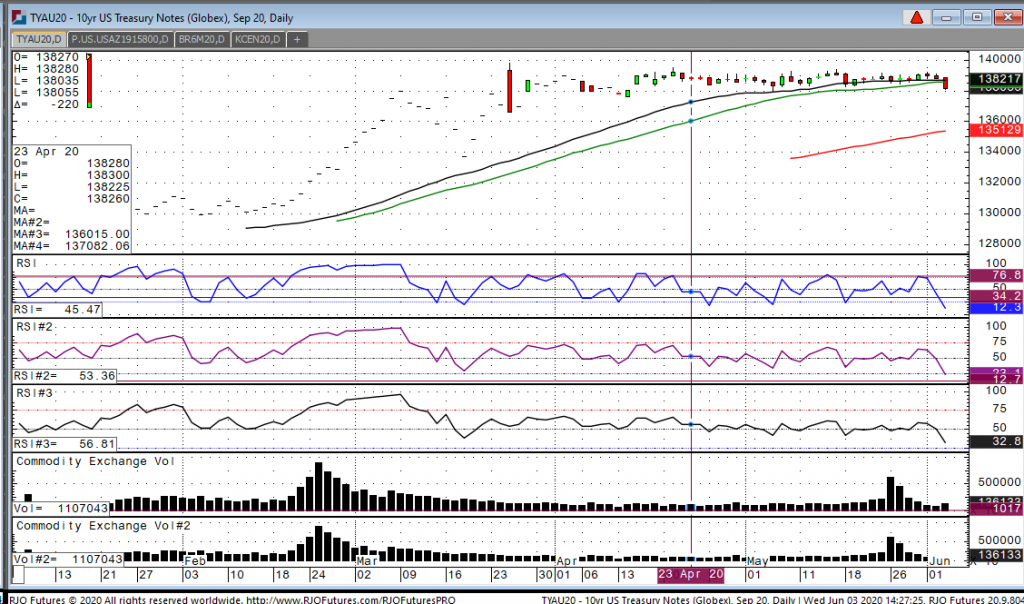
U.S. Dollar Jun '20 Daily ChartInterest Rates - Rates in Focus Ahead of FOMC
Looking at the September 10-year note we see some
consolidation after interest rates hit their low in March. We have since been
trading in a range, and although the stock market continues to rally,
treasuries are very much still focused on current economic decimation. Traders
will need to watch if this consolidation continues ahead of the next FOMC
meeting on June 10th. The fed has been diligent through this crisis
and the scheduled meeting may introduce new monetary policy tools. It is of our
opinion that the name of the game is still about liquidity and money supply.
Those are the keys to economic decisions by Fed chair Powell.
10-year on technicals in the September contract has important support at 138’110, and this level will need to hold if we want to see continue consolidation or rangebound movement. A break of this level we could see the contract trade pretty quickly to 138’000 and lower. The market remains poised to test the higher range at 139’040 and a break of this with supporting fundaments we can see a test of 139’110 or higher.
10yr Note Sep '20 Daily Chart If you have any questions or would like to discuss the markets further, please feel free to contact me at 800-826-2270 or gperlin@rjofutures.com. Equity - Jobs Number Blowout Moves Stocks Even Higher
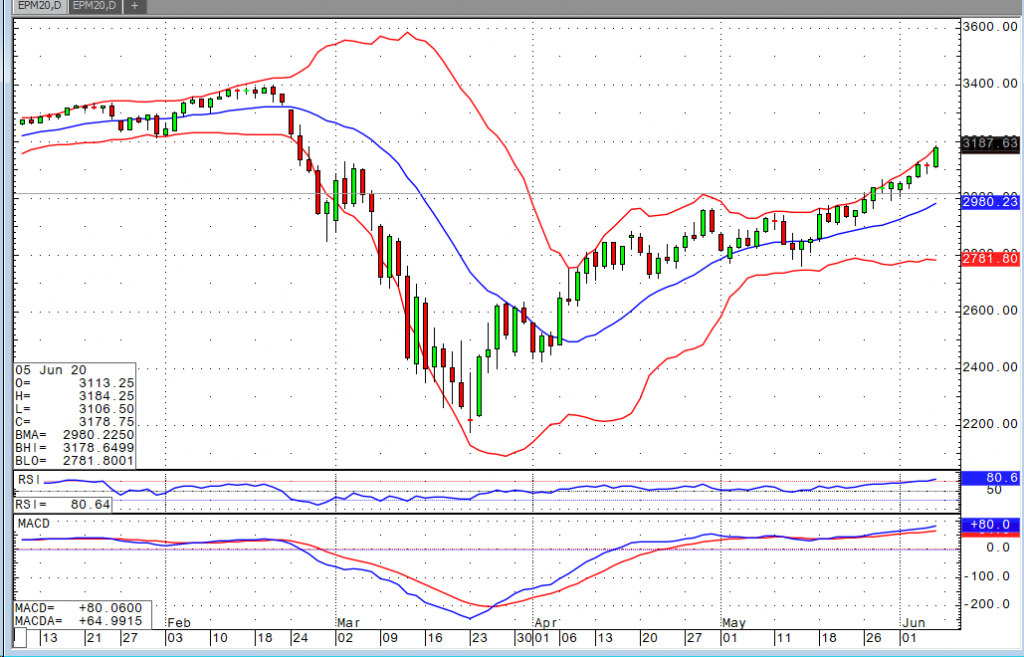
Jobs Number Blowout Moves Stocks Even Higher
By: Bill Dixon, Senior Market StrategistPosted Jun 5, 2020 9:38AM CT
This morning’s non-farm payrolls data were expecting to see a figure in the neighborhood of -7.7M and an unemployment rate of about 19.8%. Instead we added 2.5M jobs (about 3.1M of that was private payrolls w/ the losses largely coming from local government jobs) and saw an unemployment rate of 13.3%. It is safe to say that while stocks have discounted most, if not all, the bad news that you see or read about, but it did not expect this kind of number. The Dow is up 700 (2.65%), the Nasdaq is up 130 (1.37), the S&P is up 63 (2%), and the Russell is up 55 (3.77%). It is hard to say where this number takes us with the other indices, but the Nasdaq has now eclipsed the pre-shutdown highs.
The market has come back to an incredible degree in a very short period. I can understand the stance that we are due for a pullback given all the headlines out there. However, you could also argue that we’ve seen the pullback that everyone was calling for prior to the shutdowns. If we continue to see data anywhere near what we did today, a selloff of significance becomes increasingly unlikely.
E-mini S&P 500 Jun '20 Daily Chart If you have any questions or would like to discuss the markets further, please feel free to contact me at 800-669-5354 or bdixon@rjofutures.com. Economy - S-T Mo Failure Insufficient to End RBOB Correction, But Beware
S-T Mo Failure Insufficient to End RBOB Correction, But Beware
By: RJO Market InsightsPosted 11/08/2022
Posted on Nov 08, 2022, 07:51 by Dave Toth
In Fri's Technical Webcast we identified a
minor corrective low at 2.6328 from Thur as a mini risk parameter the market
needed to sustain gains above to maintain a more immediate bullish count.
The 240-min chart below shows the market's failure overnight below this level,
confirming a bearish divergence in very short-term momentum. This mo
failure defines Fri's 2.8172 high as
one of developing importance and a parameter from which very short-term traders
can objectively base non-bullish decisions like long-covers.
Given
the magnitude of the past three weeks' broader recovery however, this
short-term momentum failure is of an insufficient scale to conclude anything
more than another correction within this broader recovery from 26-Sep's 2.1877
low. Indeed, overnights failure below 2.6328 only allows us to conclude
the end of the portion of the month-and-a-half rally from 31-Oct's 2.4822 next
larger-degree corrective low. 2.4822 is the
risk parameter this market still needs to fail below to break the uptrend from
18-Oct's 2.3526 low while this 2.3526 low
remains intact as the risk parameter this market needs to fail below to break
the month-and-a-half uptrend. From an
intermediate-to-longer-term perspective, this week's setback falls well within
the bounds of another correction ahead of further gains. This is another
excellent example of the importance of technical and trading SCALE and
understanding and matching directional risk exposure to one's personal risk
profile.
The
reason overnight's admittedly minor mo failure might have longer-term
importance is the 2.8172-area from which it stemmed. In
Fri's Technical Blog we also noted the market's engagement of the
2.8076-to-2.8159-area marked by the 61.8% retrace of Jun0-Sewp's 3.2758 -2.1877
decline and the 1.000 progression of Sep-Oct's initial 2.1877 - 2.6185
(suspected a-Wave) rally from 18-Oct's 2.3526 (suspected b-Wave) low. We
remind longer-term players that because of the unique and compelling confluence
of:
early-Aug's bearish divergence in WEEKLY momentum
amidst
historically
extreme bullish sentiment/contrary opinion levels in our RJO Bullish
Sentiment Index
an
arguably complete and massive 5-wave Elliott sequence from Mar'20's 0.4605
low to Jun's 4.3260 high (as labeled in the weekly log active-continuation
chart below) and
the
5-wave impulsive sub-division of Jun-Sep's (suspected initial 1st-Wave) decline
The
recovery attempt from 26-Sep's 2.1877 low is arguably only a 3-wave (Wave-2)
corrective rebuttal to Jun-Sep's decline within a massive, multi-quarter
PEAK/reversal process. Now granted, due to the magnitude of 2020 -2022's
secular bull market, we discussed the prospect for this (2nd-Wave corrective)
recovery to be "extensive" in terms of both price and time. A
"more extensive" correction is typified by a retracement of 61.8% or
more and spanning weeks or even months following a 3-month decline. Per
such, the (suspected corrective) recovery from 26-Sep's 2.1877 low could easily
have further to go, with commensurately larger-degree weakness than that
exhibited this week (i.e., a failure below at least 2.4822) required
to consider the correction complete. Indeed, the daily log chart above
shows the market thus far respecting former 2.6185-area resistance from 10-Oct
as a new support candidate.
These
issues considered, very shorter-term traders have been advised to move to a neutral/sideline
position following overnight's momentum failure below 2.6328, with a recovery
above 2.8172 required to negate this call, reaffirm the recovery and re-expose
potentially significant gains thereafter. For intermediate- and
longer-term players, a bullish policy and exposure remain advised with a
failure below 2.4822 required to threaten this call enough to warrant
neutralizing exposure. We will be watchful for another bearish divergence
in momentum following a recovery attempt that falls short of Fri's 2.8172 high
that would be considered the next reinforcing factor to a count calling that
2.8172 high the prospective end to the month-and-a-half 2nd-Wave
correction. In lieu of such, a resumption of the current rally to
eventual new highs above 2.8172 should not surprise.