
RJO FuturesCast
September 4, 2020 | Volume 14, Issue 36Feature Articles
New: Metals Investor Kit

Opportunities Exist in the Metals Markets Right Now –
Precious metals like gold and silver seem to be all anybody is talking about these days, and with good reason! Have you ever wanted to get in on these current opportunities in the metals but didn’t know where to start? Our Metals Investor Kit has you covered. Whether you are experienced or new to trading, our kit will give you the tools to take advantage of the opportunities that exist in the metals markets right now!
RJO Futures PRO Trading Platform

FREE 100k Simulated Trading Account
Experience a trading platform like no other with integrated tools to seamlessly trade and monitor the markets. With a free simulated trading account and personal broker experience, we’ll teach you about futures trading and help you develop a trading strategy.
![]()
The Markets

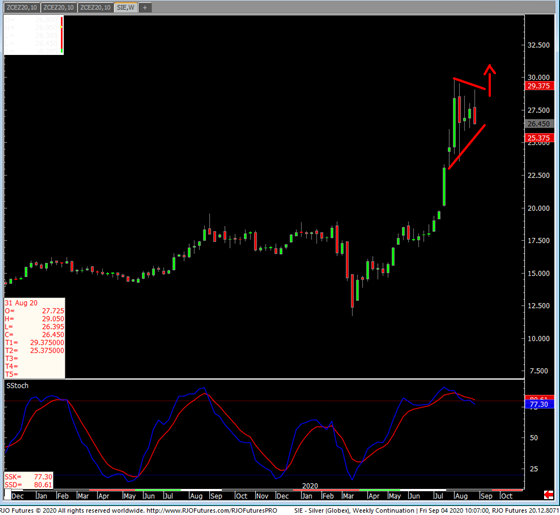
December Silver is trading $26.535, down 295 cents. The equity market is cratering to the downside. No benefit so far for silver from equity weakness. The U.S. dollar has been materially strong, putting silver on the defensive. The dollar appears to be in sideways to higher price action in the coming weeks. I do not rule out a wash below $25.00 for silver. Any weakness will be, again, bought rather than sold. I do not expect silver to stay below $25.00, mostly, if we start to see recovery or stabilization of equities, with the U.S. election just around the corner. The appetite for silver will remain strong. There may be some profit-taking in the meantime. As seen below, the weekly chart, Silver doesn't look bearish in my view. But again, a decent washout in silver might be in the cards.

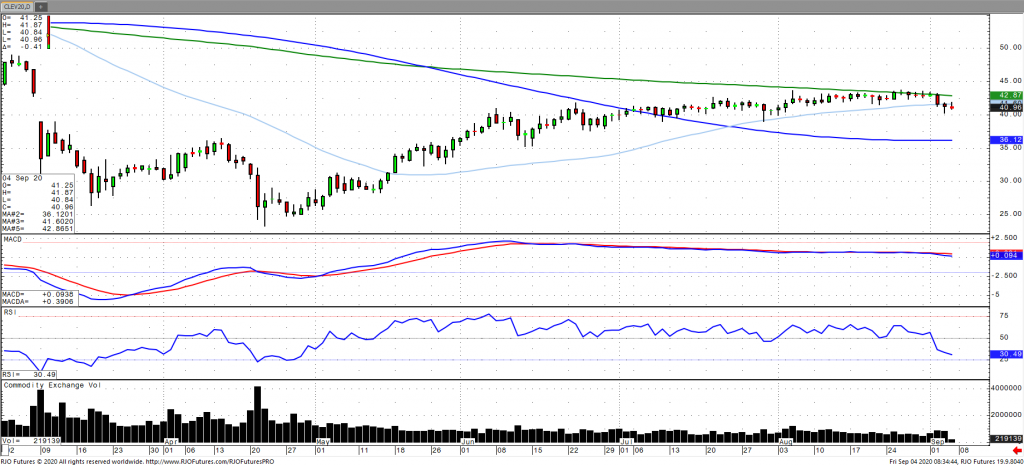
Oil prices have largely recovered following an early 3% drop yesterday as continuing claims continued to rise increasing concerns of a slowing in economic recovery and fuel demand. This comes as data from the EIA showed gasoline and distillate demand readings fell. Refinery runs are set to be operating at a low rate, which will only further dent demand for oil. Reports of slowing Chinese demand due to restocking has continued to weigh on sentiment as well as reports that Iraq may be looking for an exemption of OPEC plus production cuts. A firmer dollar over the course of the last couple of sessions has also contributed to the downward pressure on prices. The market remains bullish trend with today’s range seen between 40.95 – 43.88.

While commensurately larger-degree weakness below 14-Jul's 11.27 larger-degree corrective low remains required to, in fact, break Apr-Aug's broader uptrend, we believe the extent, impulsiveness and decisiveness with which this market demolished our short-term risk parameter defined by 10-Aug's 12.41 corrective low and key area of former resistance-turned-support warns of exactly such a broader peak/reversal environment. On a smaller scale, this week's resumed slide leaves 28-Aug's 12.84 high in its wake as the latest smaller-degree corrective high the market is now minimally required to recover above to threaten a broader peak/reversal count. Per such, this 12.84 level becomes our new short-term but key risk parameter from which non-bullish decisions like long-covers and new bearish punts can be objectively based and managed.
Stepping back, the daily chart above shows today's break below an area of former resistance around 12.32-to-12.27 that, since broken in late-Jul, should have held as new support if the market was still truly strong. The market's failure to sustain 12.25+ levels is not necessarily the death knell to our bullish count introduced in 30-Apr's Technical Blog, however:
- the market confirmed a bearish divergence in daily momentum that defines 14-Aug's 13.28 high as one of developing importance and
- the prospective high to a textbook 5-wave Elliott sequence up from 28-Apr's 9.21 low amidst a
- historically frothy (87%) level in our RJO Bullish Sentiment Index of the hot Managed Money positions reportable to the CFTC (its highest reading since Feb'17) and
- a recovery that came within six ticks of the (13.34) 61.8% retrace of Feb-Apr's 15.90 - 9.21 meltdown on a weekly linear scale below.
These incriminating issues considered and given the impracticality of a larger-degree risk parameter at 11.27 back in the middle of Apr-Aug's range, both short- and long-term traders are advised to neutralize all previously recommended bullish exposure if they haven't done so already and first approach recovery attempts to 12.25 OB as corrective selling opportunities ahead of what we believe will be a more protracted correction of Apr-Aug's rally that could span weeks or even months and to levels below 11.00. A recovery above at least 12.84 is required to threaten this call and warrant moving back to the sidelines.

Posted on Oct 14, 2022, 07:42 by Dave Toth
On the heels of mid-Sep-to-early-Oct's steeper, accelerated, 3rd-wave-looking recovery, the past week-and-a-half's boringly lateral chop is first considered a corrective/consolidative event that warns of a continuation of the uptrend that preceded it to new highs above 04-Oct's 891.0 high. This count remains consistent with our broader base/correction/recovery count introduced in 13-Sep's Technical Blog following that day's bullish divergence in short-term momentum above 07-Sep's 809.5 minor corrective high detailed in the hourly chart below.
The important takeaway from this month's lateral, sleepy price action is the definition of Wed's 851.5 low as the end or lower boundary of a suspected 4th-Wave correction. A failure below 851.5 will confirm a bearish divergence in daily momentum and defer or threaten a bullish count enough to warrant non-bullish decisions like long-covers. A failure below 851.5 will not necessarily negate a broader bullish count, but it will threaten it enough to warrant defensive measures as the next pertinent technical levels below 851.5 are 13-Sep's prospective minor 1st-Wave high at 813.8 and obviously 08-Sep's 766.0 low. And making non-bullish decisions "down there" is sub-optimal to say the least. Per such, both short- and longer-term commercial traders are advised to pare or neutralize bullish exposure on a failure below 851.5, acknowledging and accepting whipsaw risk- back above 04-Oct's 891.0 high- in exchange for much deeper and sub-optimal nominal risk below 766.0.


On a broader scale, the daily log scale chart above shows the developing potential for a bearish divergence in daily momentum that will be considered confirmed below 851.5. This chart also shows the past month's recovery thus far stalling in the immediate neighborhood of the (888.0) Fibonacci minimum 38.2% retrace of Apr-Sep's entire 1128 - 766 decline). COMBINED with a failure below 851.5, traders would then need to be concerned with at least a larger-degree correction pf the past month's rally and possibly a resumption of Apr-Sep's major downtrend.
Until and unless the market fails below 851.5 however, we would remind longer-term players of the key elements on which our bullish count is predicated:
- a confirmed bullish divergence in WEEKLY momentum (below) amidst
- an historically low 11% reading in out RJO Bullish Sentiment Index and
- a textbook complete and major 5-wave Elliott sequence down from 29-Apr's 1128 high to 08-Sep's 766.0 low.
Thus far, the market is only a month into correcting a 4-MONTH, 32% drawdown, so further and possibly protracted gains remain well within the bounds of a major (suspected 2nd-Wave) correction of Apr-Sep's decline within an even more massive PEAK/reversal process from 17-May's 1219 high on an active continuation basis below.
These issues considered, a bullish policy and exposure remain advised with a failure below 851.5 required to defer or threaten this call enough to warrant moving to a neutral/sideline position. In lieu of such weakness, we anticipate a continuation of the past month's rally to new highs and potentially significant gains above 891.0.

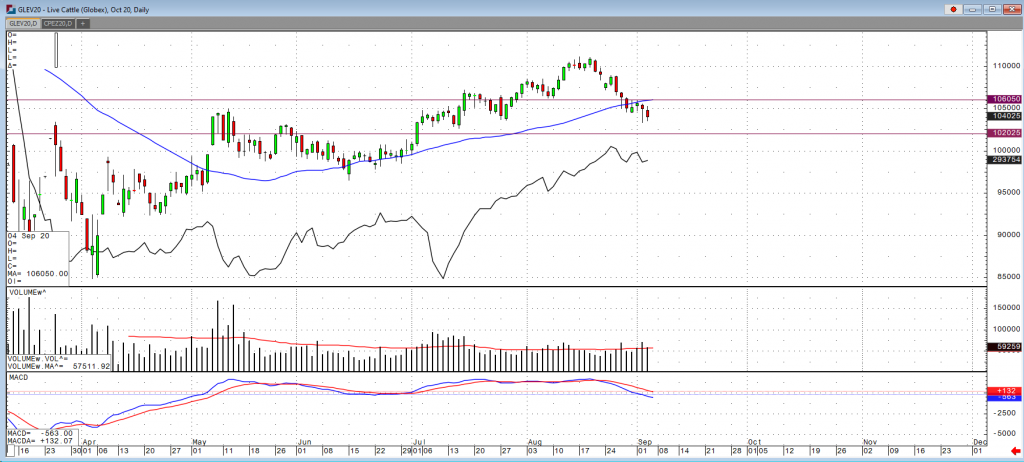
Fat cattle is still in a downtrend overall and if this trend continues, we will start to see the premium being held in the Oct contract diminish to the cash market. Right now, feedlots are stocked with market ready cattle along with the availability of those feedlots to move feeder cattle. One thing to consider would be if the slaughter numbers for September comes in below what we are expecting, then the high weight problem could cause these prices to rally. The USDA boxed beef cutout was down 67 cents at mid-session yesterday and closed 34 cents lower at $227.24. This was down from $231.54 the previous week and was the lowest the cutout had been since August 21. Cash live cattle are trading roughly $1-2 lower this week. On Thursday 1,620 head traded in Kansas at $102-$103 and an average price of $102.92, down from $104.05 a week before. In Nebraska 2,455 head traded at $102, down from $103-$105 and an average price of $103.71 a week ago. In Texas/Oklahoma 1,816 head traded at $102-$103 and an average price of $102.01, down from $104.76 a week ago.
US beef export sales for the week ending August 27 came in at 11,354 tonnes, down from 11,789 the previous week and the lowest they have been since July 2. The average for the previous four weeks is 14,086. Cumulative sales have reached 690,855 tonnes down from 717,792 last year at this time and 714,935 at this point in 2018. The five-year average is 643,050. The largest buyer this week was Japan at 2,594 tonnes, followed by South Korea at 1,993, China at 1,820 and Taiwan at 1,504. Japan has purchased the most from the US so far for 2020 at 204,158 tonnes, followed by South Korea at 189,777 and Hong Kong at 78,655. China is seventh at 23,978 tonnes. The USDA estimated cattle slaughter came in at 118,000 head yesterday. This brings the total for the week so far to 474,000 head, up from 472,000 last week and up from 352,000 a year ago.

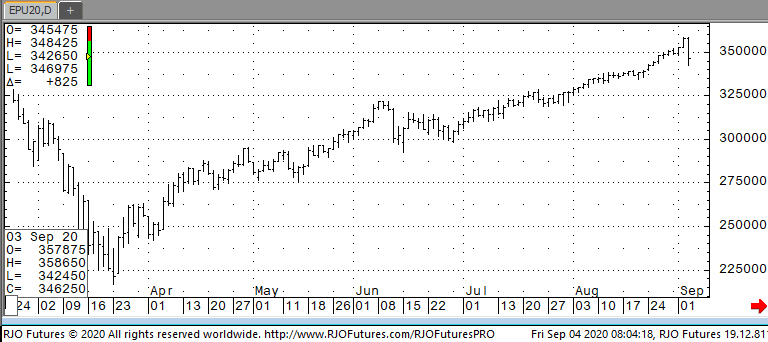
U.S. stocks had a mixed open this morning after seeing the worst single session drop yesterday in three months. The Nasdaq continued its tech stock sell off while the Dow and S&P 500 rallied on a better than expected payroll number for August. The Labor Department released data this morning that showed an increase in nonfarm payrolls of 1.37 million in August and the unemployment rate dropped to 8.4% This was much better than the anticipated growth of 1.32 million jobs and a 9.8% rate. The August rate was the lowest it has been since the coronavirus shutdown in March. “We are still moving in the right direction and the pace of the jobs recovery seems to have picked up, but it still looks like it will take a while-and likely a vaccine-before we get close to where we were at the beginning of this year,’ said Tony Bedikan, head of global markets at Citizens Bank. “We continue to be optimistic that the economy has turned a corner and that we’ll continue to see steady progress.”
Support today is 277500 and 273000 with resistance at 354000 and 365000.
Posted on Nov 08, 2022, 07:51 by Dave Toth
In Fri's Technical Webcast we identified a minor corrective low at 2.6328 from Thur as a mini risk parameter the market needed to sustain gains above to maintain a more immediate bullish count. The 240-min chart below shows the market's failure overnight below this level, confirming a bearish divergence in very short-term momentum. This mo failure defines Fri's 2.8172 high as one of developing importance and a parameter from which very short-term traders can objectively base non-bullish decisions like long-covers.
Given the magnitude of the past three weeks' broader recovery however, this short-term momentum failure is of an insufficient scale to conclude anything more than another correction within this broader recovery from 26-Sep's 2.1877 low. Indeed, overnights failure below 2.6328 only allows us to conclude the end of the portion of the month-and-a-half rally from 31-Oct's 2.4822 next larger-degree corrective low. 2.4822 is the risk parameter this market still needs to fail below to break the uptrend from 18-Oct's 2.3526 low while this 2.3526 low remains intact as the risk parameter this market needs to fail below to break the month-and-a-half uptrend. From an intermediate-to-longer-term perspective, this week's setback falls well within the bounds of another correction ahead of further gains. This is another excellent example of the importance of technical and trading SCALE and understanding and matching directional risk exposure to one's personal risk profile.


The reason overnight's admittedly minor mo failure might have longer-term importance is the 2.8172-area from which it stemmed. In Fri's Technical Blog we also noted the market's engagement of the 2.8076-to-2.8159-area marked by the 61.8% retrace of Jun0-Sewp's 3.2758 -2.1877 decline and the 1.000 progression of Sep-Oct's initial 2.1877 - 2.6185 (suspected a-Wave) rally from 18-Oct's 2.3526 (suspected b-Wave) low. We remind longer-term players that because of the unique and compelling confluence of:
- early-Aug's bearish divergence in WEEKLY momentum amidst
- historically extreme bullish sentiment/contrary opinion levels in our RJO Bullish Sentiment Index
- an arguably complete and massive 5-wave Elliott sequence from Mar'20's 0.4605 low to Jun's 4.3260 high (as labeled in the weekly log active-continuation chart below) and
- the 5-wave impulsive sub-division of Jun-Sep's (suspected initial 1st-Wave) decline
The recovery attempt from 26-Sep's 2.1877 low is arguably only a 3-wave (Wave-2) corrective rebuttal to Jun-Sep's decline within a massive, multi-quarter PEAK/reversal process. Now granted, due to the magnitude of 2020 -2022's secular bull market, we discussed the prospect for this (2nd-Wave corrective) recovery to be "extensive" in terms of both price and time. A "more extensive" correction is typified by a retracement of 61.8% or more and spanning weeks or even months following a 3-month decline. Per such, the (suspected corrective) recovery from 26-Sep's 2.1877 low could easily have further to go, with commensurately larger-degree weakness than that exhibited this week (i.e., a failure below at least 2.4822) required to consider the correction complete. Indeed, the daily log chart above shows the market thus far respecting former 2.6185-area resistance from 10-Oct as a new support candidate.
These issues considered, very shorter-term traders have been advised to move to a neutral/sideline position following overnight's momentum failure below 2.6328, with a recovery above 2.8172 required to negate this call, reaffirm the recovery and re-expose potentially significant gains thereafter. For intermediate- and longer-term players, a bullish policy and exposure remain advised with a failure below 2.4822 required to threaten this call enough to warrant neutralizing exposure. We will be watchful for another bearish divergence in momentum following a recovery attempt that falls short of Fri's 2.8172 high that would be considered the next reinforcing factor to a count calling that 2.8172 high the prospective end to the month-and-a-half 2nd-Wave correction. In lieu of such, a resumption of the current rally to eventual new highs above 2.8172 should not surprise.


Global Equities
*Europe with a big night. GER and FRA leading charge, both up more the > 2.00%.
*US Equity Futures also putting on a show with the NASDAQ plowing to new all-time highs in the futures overnight, +1.19%.
*SP500 and NASDAQ remain bullish trend, and the Russell 2000 still bearish trend, still lagging the majors.
*Shanghai slipped a bit overnight -0.17%, still bullish trend. We may signal here, I’m going to look into the Chinese A Shares Index. Stay tuned
*US Small Caps via the Russell 2000 triggering immediate OVERBOUGHT this morning.
Stock Market OPINION:
*We’re getting “there” in terms of over exuberance in equities in our opinion. Stock splits (which add no fundamental value to the companies themselves) are typically met with consolidation and corrective periods soon to follow, sure enough this was NOT the case for AAPL and TSLA, as smaller investors found there way into those stocks Monday and Tuesday.
*Keep a close watch on Implied Volatility. The VIX index has been “sneaky”, as has been the VXN (NASDAQ Vol), with both rising in recent sessions to near “break out” levels. This is something to monitor closely.
*The trend and momentum in the SP500, and NASDAQ are very powerful, and any corrective dips of 3-5% will likely be met with STRONG buying interest in my opinion.
Top Market Movers
Currencies
*A continuation counter-trend bounce higher in the US Dollar overnight vs the major foreign players. USD remains bearish trend, and we’ll be hunting for “Short” opportunities here.
*Did you know…The USD has carried a nearly 1 to 1 inverse correlation to US Stocks since May/June. So if you need any questions answered in terms of “fuel” for the stock rally, its been the weakening/devaluing of YOUR PURCHASING POWER.
*The Japanese Yen is looking more and more interesting as it approaches immediate-oversold territory vs the USD
Metals
*Gold correcting on the bounce in the USD – will likely be met with buyers closer 1940-1920 zone. Low end of our range comes in at 1919.00. Likely to swing in $100 range in the near-term.
*Silver similar to Gold – likely trapped in a wide range. Be careful “chasing” this market higher. Look to buy or add to positions closer to the low end of our range 26.90
Treasuries
*Not much to speak of here. Little change in the treasuries bonds/yields overnight following a slide back under 0.70bps on Tuesday
*I’d say a better than good chance we pull our 10yr profits off the table today – as the yields do look like they may attempt to sneak into a higher trading range moving forward.
*Another contributing factor to a “higher Dollar” and lower Gold prices this morning. You must understand this correlation to do Macro IMO.
Agriculture
*Lean Hogs had a decent bounce yesterday, putting our position in the profit zone. Chinese demand continues to be a motive for higher protein prices
*Corn and Soybeans slipped last night, likely a modest correction from their big run higher over the past 3 weeks. We’re hunting for immediate oversold/buy signals here.
Data Due Up:
ADP Jobs Report at 7:15 CST
UPDATE: 428K vs 1.00M Expected
Thursday:
Jobless ClaimsISM
Non-Manufacturing
Friday:
US NFP Payrolls at 7:30 CST
exp 1.4M Payrolls added and a 9.8% UE rate
Coming Up Next Week...
View Futures Calendar