Have you ever wanted to trade the grain markets but didn’t know where to start? Are you looking for a more informed and disciplined approach to up your trading game? Then this Investor kit is for you! In this comprehensive kit you will find everything you need to help you and take advantage of the opportunities that exist in the grain markets right now!
The Markets
Metals - Gold Futures Continue to Consolidate
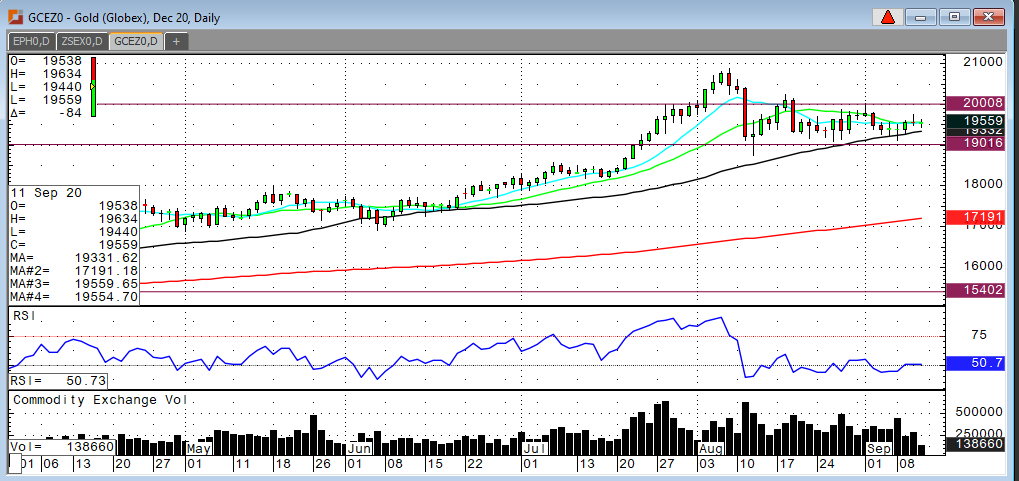
Gold Futures Continue to Consolidate
By: Frank J. Cholly, Senior Market StrategistPosted Sep 11, 2020 9:35AM CT
It’s not unusual for a market to trade sideways after a huge
rally and subsequent correction. The market usually needs to take a “breather”.
Figures things out. Was the rally justified? The answer to that question is
yes, absolutely. So, we’re left scratching our heads now because gold can’t
seem to break out and hold above $2,000. Nothing has really changed in all the
various bullish arguments. ETF inflows continue. The Dollar is still weak. The
Fed has promised to keep rates low for long, and to allow inflation to
overshoot its target rate. Has all the uncertainty gone away? Of course not!
Fiscal stimulus has stalled but that’s just politics. There’s more to come…
There’s a clear and definable trading range. I still think that we will see $2,100 before $1,800 and that you should play gold from the long side with some Put protection. The market could trade sideways for a long time, but not forever. Perhaps we just went too far too fast. All the bullish factors that drove gold prices towards $2,100 are still here today and not likely to go away. The Fed can print money but it can’t print gold and we will start to see gold supplies tighten and then its off to the races.
Gold Dec '20 Daily Chart If you have any questions or would like to discuss the markets further, please feel free to contact me at 800-826-4124 or fcholly@rjofutures.com. Metals - Silver in Decline, Still Higher Than Last Year
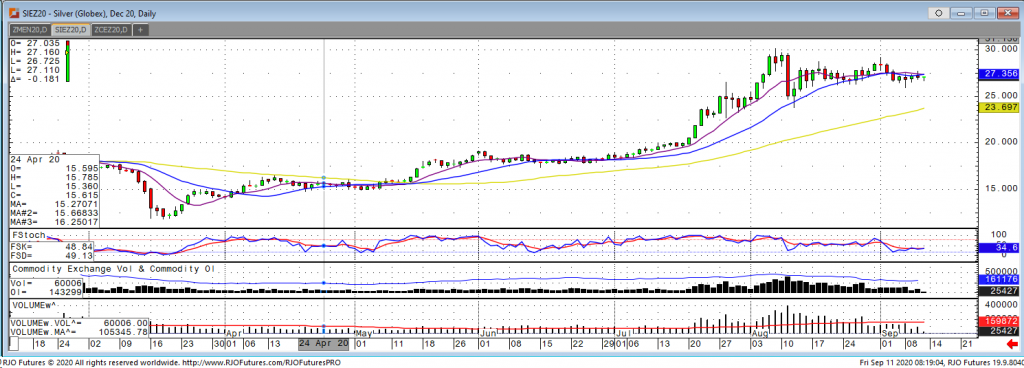
December silver started this holiday shortened week trading down to a low of 25.985 before coming off that low and trading sideways the rest of the week. There haven’t been any major economic data surprises to push this market one way or the other with the ECB meeting not showing any indication of fresh stimulus and today’s US inflation reading looking to come in line with expectations. Recently the silver market is following the U.S. dollar moves, which has seen some strength lately, hindering a push higher in silver. Also curbing any move higher is disappointing demand with outflows in silver ETFs. This has been the sixth straight decline but despite that, silver holdings are still above levels from this time last year. The December silver contract has support at 26.30 and then the 25.00 level with resistance at 28.10. The market would need to close above this week’s high of 27.755 in order to get back to a trend higher and test resistance levels. As of now I think that is going to depend mostly on what the US dollar and the stock market does. It will also be interesting to see if silver remains trading like a commodity, in line with the stock market, or goes back to the traditional relationship, seeing strength in a risk off environment.
Silver Dec '20 Daily Chart If you have any questions or would like to discuss the markets further, please feel free to contact me at 800-826-2270 or therrmann@rjofutures.com. Energy - Oil Lower on Rising Stockpiles Amid Weaker Demand
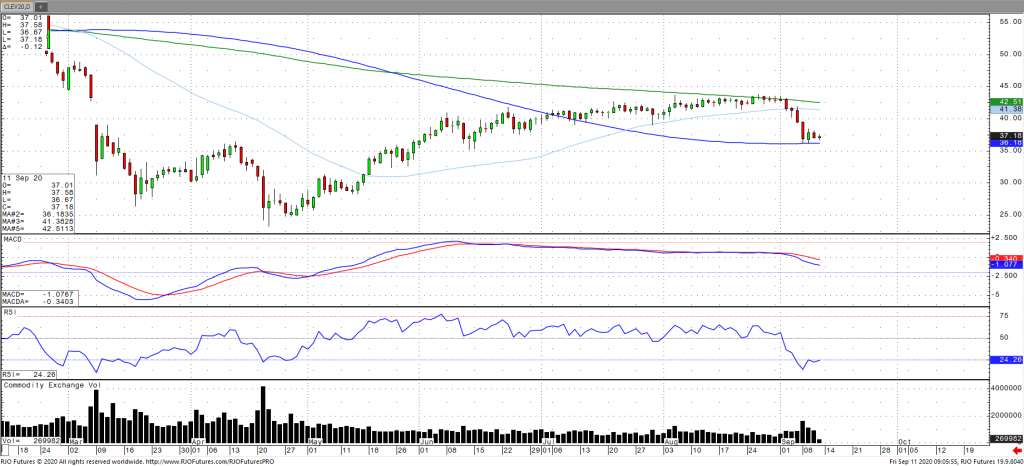
Oil prices are softer once again in the early session after falling nearly 2% on Thursday as the market was pressured by an increase in stockpiles as the virus continues to weigh on demand prospects. US refinery rates continue to be subdued, which would only set to add to oil stocks in the coming weeks. Onshore storage remains near capacity with floating storage seemingly in play as low financing and the current spreads between contracts for delivery are more favorable for the sale of oil later. A monitoring panel of OPEC+ are scheduled to meet on September 17th with the focus on compliance rather than a revision of cuts. Prices are down about 6.5% on the week and headed for a second week of declines with the market now transitioning to neutral trend. Oil volatility (OVX) continues to teeter that bull/bear line of ~54 with today’s range seen between 35.63 – 40.95.
Crude Oil Dec '20 Daily Chart If you have any questions or would like to discuss the markets further, please feel free to contact me at 800-438-4805 or aturro@rjofutures.com. Softs - Coffee At Overbought Levels
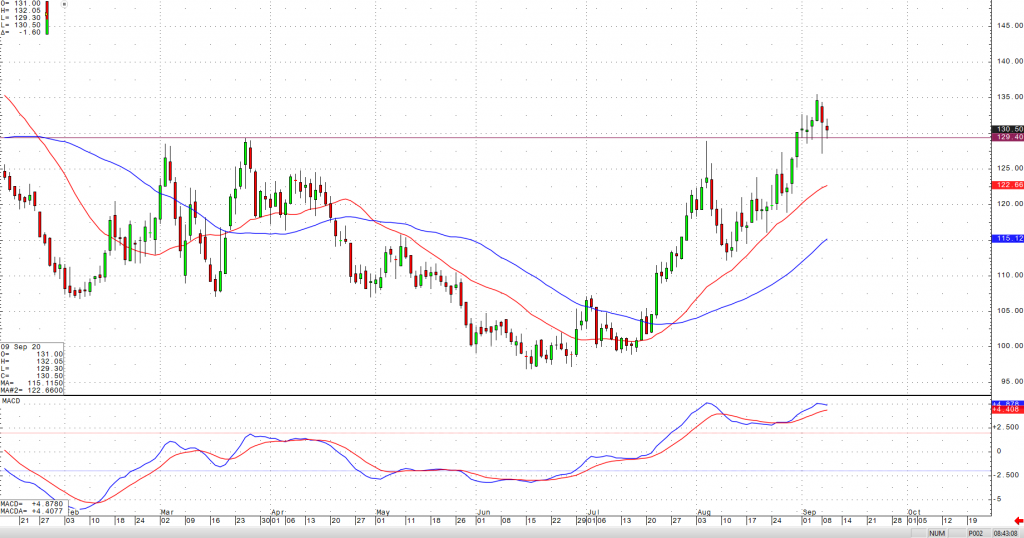
Coffee At Overbought Levels
By: Adam TuiaanaPosted 09/09/2020
While December coffee futures continue to garner support from all-time highs in the U.S. stock market and steady demand, the futures are beginning to reach overbought levels and traders should use caution at this point. Ongoing supply issues in Central America and Columbia have added good support under December coffee prices. Our friends at the Hightower Group have reported that “while it is possible that large quantities of Brazilian Arabica will be certified deliverable, it is unlikely to occur which will keep those stock levels near multi-decade lows. In addition, supply issues with Columbia and Central American producers should help to keep coffee prices fairly well supported.”
As we continue to struggle with revenues of restaurants and coffee shops being weighed down severely by limited occupancy, more and more of these cherished businesses will continue to vanish permanently. In addition, the likelihood that many small businesses will be in a hurry to return to urban areas where riots have taken place just adds more pressure and uncertainty to an already grim outlook. From a technical perspective, a recent break above the 129 level, followed by a sizeable corrective pullback, should be viewed as bullish. Resistance should be found at the 135 level and support at 120.
On
the heels of mid-Sep-to-early-Oct's steeper, accelerated, 3rd-wave-looking
recovery, the past week-and-a-half's boringly lateral chop is first considered
a corrective/consolidative event that warns of a continuation of the uptrend
that preceded it to new highs above 04-Oct's 891.0 high. This count
remains consistent with our broader base/correction/recovery count introduced
in 13-Sep's Technical Blog following that
day's bullish divergence in short-term momentum above 07-Sep's 809.5 minor
corrective high detailed in the hourly chart below.
The
important takeaway from this month's lateral, sleepy price action is the
definition of Wed's 851.5 low as
the end or lower boundary of a suspected 4th-Wave correction. A failure
below 851.5 will confirm a bearish divergence in daily momentum and defer or
threaten a bullish count enough to warrant non-bullish decisions like
long-covers. A failure below 851.5 will not
necessarily negate a broader bullish count, but it will threaten it enough to
warrant defensive measures as the next pertinent technical levels below 851.5 are
13-Sep's prospective minor 1st-Wave high at 813.8 and obviously 08-Sep's 766.0
low. And making non-bullish decisions "down there" is
sub-optimal to say the least. Per such, both short- and longer-term
commercial traders are advised to pare or neutralize bullish exposure on a
failure below 851.5, acknowledging and accepting whipsaw risk- back above 04-Oct's
891.0 high- in exchange for much deeper and sub-optimal nominal risk below
766.0.
On
a broader scale, the daily log scale chart above shows the developing potential
for a bearish divergence in daily momentum that will be considered confirmed
below 851.5. This chart also shows the past month's recovery thus far
stalling in the immediate neighborhood of the (888.0) Fibonacci
minimum 38.2% retrace of Apr-Sep's entire 1128 - 766 decline). COMBINED
with a failure below 851.5, traders
would then need to be concerned with at least a larger-degree correction pf the
past month's rally and possibly a resumption of Apr-Sep's major downtrend.
Until
and unless the market fails below 851.5 however, we would
remind longer-term players of the key elements on which our bullish count is
predicated:
a confirmed bullish divergence in WEEKLY momentum
(below)
amidst
an
historically low 11% reading in out RJO Bullish Sentiment Index and
a
textbook complete and major 5-wave Elliott sequence down from 29-Apr's
1128 high to 08-Sep's 766.0 low.
Thus
far, the market is only a month into correcting a 4-MONTH, 32% drawdown, so
further and possibly protracted gains remain well within the bounds of a major
(suspected 2nd-Wave) correction of Apr-Sep's decline within an even more
massive PEAK/reversal process from 17-May's 1219 high on an active continuation
basis below.
These
issues considered, a bullish policy and exposure remain advised with a failure
below 851.5 required to defer or threaten this call enough to warrant moving to
a neutral/sideline position. In lieu of such weakness, we anticipate a
continuation of the past month's rally to new highs and potentially significant
gains above 891.0.
Agricultural - Grain Futures Update w/Stephen Davis 09/10/2020
Grain Futures Update w/Stephen Davis 09/10/2020
By: Stephen DavisPosted 09/10/2020
Stephen Davis discusses the latest news in the grain markets. China is still aggressively buying U.S. corn and that is good news for the grain market as a whole.Currency - USD Biased Towards Bears
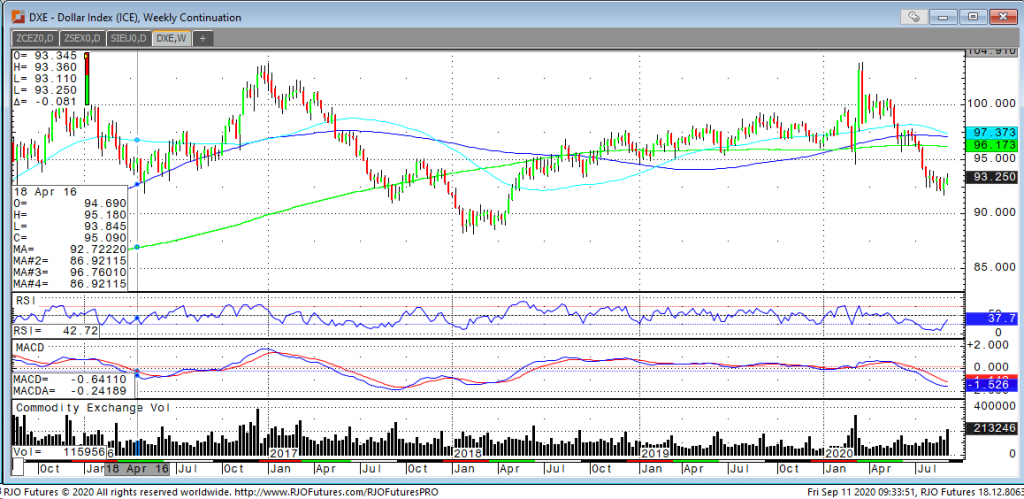
While the dollar index is tracking lower early today, the definitive rejection of yesterdays strong spike down washout certainly tempers the bear case. Further, it would appear that yesterdays low of 92.70 is some form of important technical level as that level saw 3 consecutive closes clustered at that level and it appears that selling is quickly dried up at that level yesterday. In retrospect, it seems that the dollar has regained interest as a safe haven instrument even though anxiety in the marketplace is currently benign. U.S. claims data from yesterday rekindles fear that the U.S. recovery pace is slowing and it goes without saying that the inability of the U.S. senate and the ECB to provide assistance, adds to interest in the dollar. For the time being, the 92.70 level could be a target but without a very positive economic/psychological headline we doubt the index will punch below that level.
USD Weekly Chart If you have any questions or would like to discuss the markets further, please feel free to contact me at 800-826-2270 or tcholly@rjofutures.com. Interest Rates - Interest Rates Trending Sideways After Halt in Covid-19 Vaccine
Interest Rates Trending Sideways After Halt in Covid-19 Vaccine
Looking at the December 10-year note, we have a high for the contract at overnight 139-200 and a low of 139-095 and are currently trading 139-125. Yesterday, after the close, a big pharmaceutical company came out and said they were halting trials on a vaccine for Covid-19 due to some side-effect induced complications. This development sent stocks sharply lower early in the overnight session and sent the notes to the high of the night at 139-200. The euphoria ended rather quickly, and stocks regained their footing rather and are showing some decent strength this morning with the S&P up 60 as traders finally bought the dip after three days of carnage. Whether the gains will be sustained will be determined at the close today as the notes will likely trade opposite of where stocks are going. Technically, the notes are trading in a sideways to down pattern as the market looks to retest lasts weeks low at 138-22. If we break the price, we could see 138-08-10 area, but if that level should hold a test of last nights high looks to be in the cards. Traders should be watching price action in stocks today and if we can see weakness later in the day, notes certainly could catch a bid.
10-Year Note Dec '20 Daily Chart If you have any questions or would like to discuss the markets further, please feel free to contact me at 800-826-2270 or gperlin@rjofutures.com. Equity - Negative News Weighing on Equities
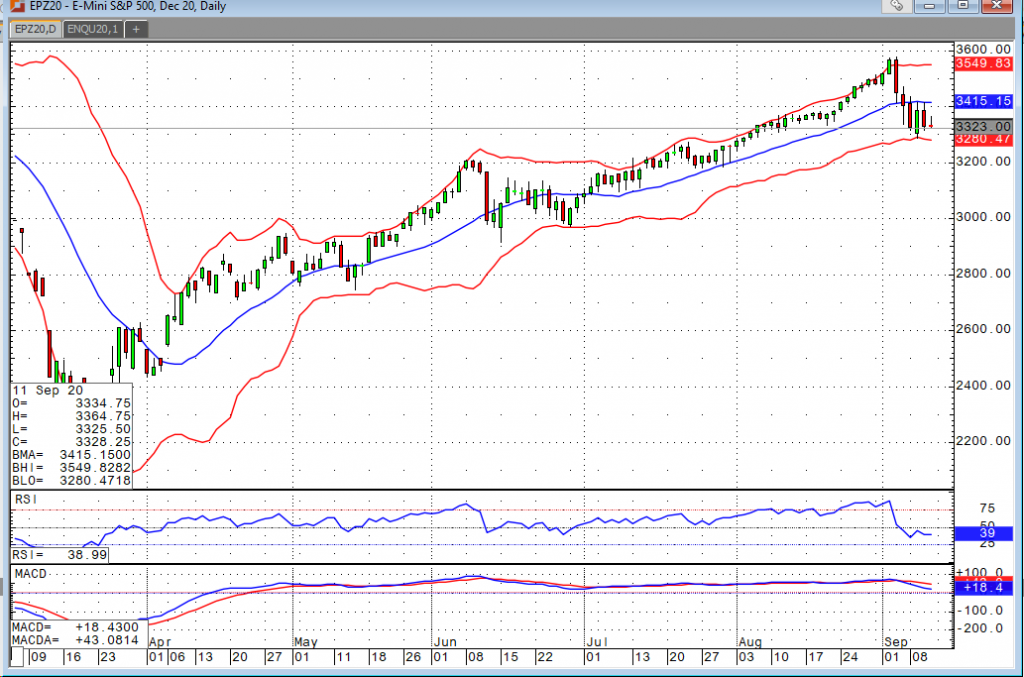
While the markets were higher in the early going today, they’re backing off, and the last few sessions have been far from pretty. Yesterday’s failure to pass another stimulus package provided the fuel that the bears needed to drive this market lower yet again. It is looking increasingly likely that there will not be a stimulus package before the election in November. Election years continue to get nastier, everything is political now, and we’ll just have to deal with it for the next seven and a half weeks. Risk has returned to the market, and it appears cash is on its way to becoming king again. Those that have been condemning the rally for months now seem to be beating their chests on the airwaves these days, calling it a bubble, talking about how badly this will end, etc. They may be right, but the selloffs (aside from the corona virus driven selloff) have tended to be pretty short-lived. That said, with the upcoming election, the FOMC meeting next week, Coronavirus cases reemerging in Europe, and so on, there is certainly plenty of reason for the dip buyers to be a little more protective of the profits they’ve accumulated over the last several months.
E-mini S&P 500 Dec '20 Daily Chart If you have any questions or would like to discuss the markets further, please feel free to contact me at 800-669-5354 or bdixon@rjofutures.com. Economy - S-T Mo Failure Insufficient to End RBOB Correction, But Beware
S-T Mo Failure Insufficient to End RBOB Correction, But Beware
By: RJO Market InsightsPosted 11/08/2022
Posted on Nov 08, 2022, 07:51 by Dave Toth
In Fri's Technical Webcast we identified a
minor corrective low at 2.6328 from Thur as a mini risk parameter the market
needed to sustain gains above to maintain a more immediate bullish count.
The 240-min chart below shows the market's failure overnight below this level,
confirming a bearish divergence in very short-term momentum. This mo
failure defines Fri's 2.8172 high as
one of developing importance and a parameter from which very short-term traders
can objectively base non-bullish decisions like long-covers.
Given
the magnitude of the past three weeks' broader recovery however, this
short-term momentum failure is of an insufficient scale to conclude anything
more than another correction within this broader recovery from 26-Sep's 2.1877
low. Indeed, overnights failure below 2.6328 only allows us to conclude
the end of the portion of the month-and-a-half rally from 31-Oct's 2.4822 next
larger-degree corrective low. 2.4822 is the
risk parameter this market still needs to fail below to break the uptrend from
18-Oct's 2.3526 low while this 2.3526 low
remains intact as the risk parameter this market needs to fail below to break
the month-and-a-half uptrend. From an
intermediate-to-longer-term perspective, this week's setback falls well within
the bounds of another correction ahead of further gains. This is another
excellent example of the importance of technical and trading SCALE and
understanding and matching directional risk exposure to one's personal risk
profile.
The
reason overnight's admittedly minor mo failure might have longer-term
importance is the 2.8172-area from which it stemmed. In
Fri's Technical Blog we also noted the market's engagement of the
2.8076-to-2.8159-area marked by the 61.8% retrace of Jun0-Sewp's 3.2758 -2.1877
decline and the 1.000 progression of Sep-Oct's initial 2.1877 - 2.6185
(suspected a-Wave) rally from 18-Oct's 2.3526 (suspected b-Wave) low. We
remind longer-term players that because of the unique and compelling confluence
of:
early-Aug's bearish divergence in WEEKLY momentum
amidst
historically
extreme bullish sentiment/contrary opinion levels in our RJO Bullish
Sentiment Index
an
arguably complete and massive 5-wave Elliott sequence from Mar'20's 0.4605
low to Jun's 4.3260 high (as labeled in the weekly log active-continuation
chart below) and
the
5-wave impulsive sub-division of Jun-Sep's (suspected initial 1st-Wave) decline
The
recovery attempt from 26-Sep's 2.1877 low is arguably only a 3-wave (Wave-2)
corrective rebuttal to Jun-Sep's decline within a massive, multi-quarter
PEAK/reversal process. Now granted, due to the magnitude of 2020 -2022's
secular bull market, we discussed the prospect for this (2nd-Wave corrective)
recovery to be "extensive" in terms of both price and time. A
"more extensive" correction is typified by a retracement of 61.8% or
more and spanning weeks or even months following a 3-month decline. Per
such, the (suspected corrective) recovery from 26-Sep's 2.1877 low could easily
have further to go, with commensurately larger-degree weakness than that
exhibited this week (i.e., a failure below at least 2.4822) required
to consider the correction complete. Indeed, the daily log chart above
shows the market thus far respecting former 2.6185-area resistance from 10-Oct
as a new support candidate.
These
issues considered, very shorter-term traders have been advised to move to a neutral/sideline
position following overnight's momentum failure below 2.6328, with a recovery
above 2.8172 required to negate this call, reaffirm the recovery and re-expose
potentially significant gains thereafter. For intermediate- and
longer-term players, a bullish policy and exposure remain advised with a
failure below 2.4822 required to threaten this call enough to warrant
neutralizing exposure. We will be watchful for another bearish divergence
in momentum following a recovery attempt that falls short of Fri's 2.8172 high
that would be considered the next reinforcing factor to a count calling that
2.8172 high the prospective end to the month-and-a-half 2nd-Wave
correction. In lieu of such, a resumption of the current rally to
eventual new highs above 2.8172 should not surprise.