RJO FuturesCast

October 2, 2020 | Volume 14, Issue 40

The Markets

Metals - Gold Continues to Follow Equities

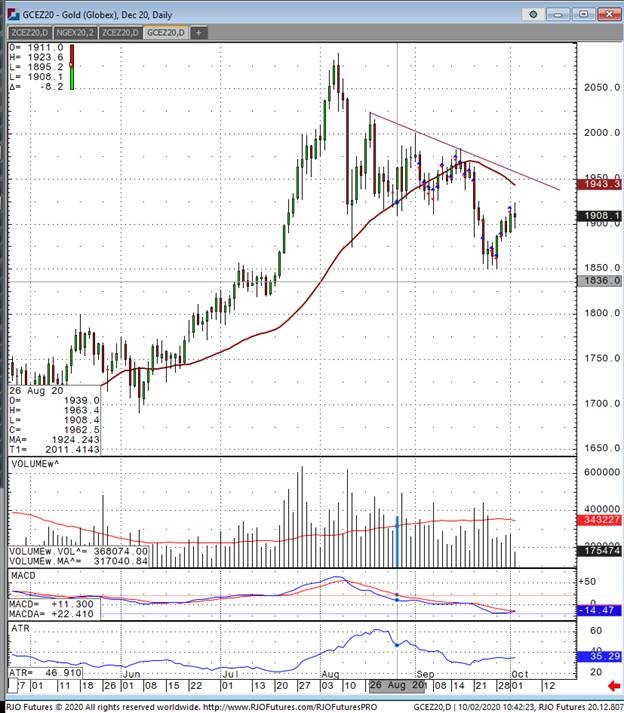
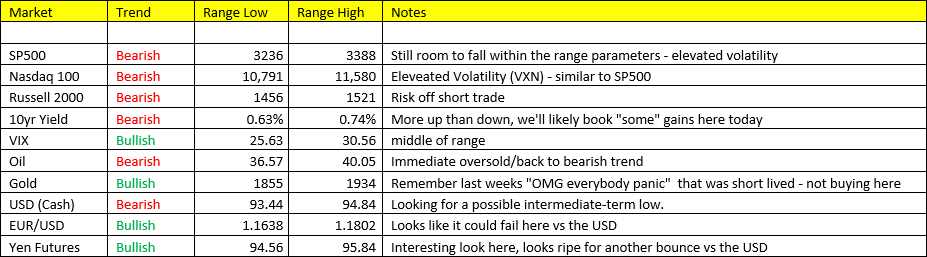
December gold future have been bouncing around in remarkable fashion over the past few weeks. The average range on gold from top to bottom on any given day is $35. That would be $3500 profit or loss on a single futures contract. We have been close to $2000 just a few weeks ago only to come crashing down to $1850 and now are back above $1910. The market fundamentally has lost a bit of steam as the new bullish themes for gold seam to have faded away. The US dollar index is also pressuring the precious metal and has also finally broke out above 94.00 which was what the market was looking for after several months of consolidation sideways. In my view the gold market has been broken down and done too much technical damage to return back above $2000. US equities are down currently and so is gold. Traders should remember the covid crash and the market reaction in gold, aggressively selling off. Should another crash in equities have any different reaction for gold? I wouldn’t bank on it. Technically gold should be coming down to around 1800 for a psychological retest of a level that some traders will see as value while others who have fought the bears throw in the towel and puke the long position. In the short term, the more aggressive the selloff is in equities the more down gold will likely be. Gold needs a close above 1955 to break a down trend with 3 points of touch going back to August 18th. Until this happens, look for gold to continue its choppy ride lower along with equities.

Gold Dec '20 Daily Chart
Metals - Silver Trading Relatively Flat

Dec silver is trading 24.270 this morning down about 2 cents. Silver is relatively weak with all the news it has been getting. Silver, even discounting the positive COVID test of President Trump, is relatively flat. Even sellers don’t have real control of the market. Then this leads me to believe that silver is really concerned with deflation. With the house passing, 2.2 trillion stimulus bill and GOP is looking to get 3.7 trillion, we are at crossroads. It remains to be seen when this will get signed by the president. It is an election year on top of that and silver is not getting even the flight to safety type of buy action. In my view, silver should be hovering at around $30.00. the fact that silver is trading this way and looking at “inside week” price action. Sellers can get really active if we go below 22.50. A break above $25 needed to give the bulls some confidence. 

Silver Weekly Chart
If you have any questions or would like to discuss the markets further, please feel free to contact me at 800-367-7290 or etesfaye@rjofutures.com.
Energy - Oil Down as President Trump Tests Positive for Covid-19

Oil prices fell nearly 4% yesterday on a dampening global demand outlook as well as a rise in output from OPEC adding to the already negative supply side fundamentals. The selloff has only continued this morning with the market down nearly 5% on reports that POTUS has been diagnosed with the coronavirus. The increase in supply came largely from Libya and Iran, who are both except from production cuts set by OPEC+, with September output increasing 160k barrels per day from August. Some support may have been garnered earlier in the week from reports of progress in US stimulus talks as well as weekly inventories showing a decline of 2 million barrels. Oil volatility (OVX) has entered a bad bucket regime with the market remaining bearish trend with today’s range seen between 36.51 – 40.14.

Crude Oil Nov '20 Daily Chart
If you have any questions or would like to discuss the markets further, please feel free to contact me at 800-438-4805 or aturro@rjofutures.com.
Softs - Cocoa Futures - Tricks and No Treats

Cocoa continues to show weakness, both fundamentally and technically. Demand for cocoa has been a concern for trader’s all year but as we enter “chocolate season” we see that even chocolate/candy purchases have been affected by Covid-19. With the majority of the U.S. putting restrictions and guidelines on Halloween festivities, chocolate companies are reporting a decline in purchases. If children aren’t going door-to-door to collect candy in most areas, what will earnings look like for Q4 for chocolate companies?

For a market that was already hurting for demand, this could push futures prices below 2400. The chart appears to be in correction territory, if 2480 is met and taken out, 2400 could be here before Halloween. 

Key growing regions are also on pace to have higher production numbers in the near-term, long-term however, Ivory Coast could have a decline in production for the 2021 season. Trader’s should monitor company earnings and ICCO estimates as we trade through the final quarter of the calendar year.

Cocoa Dec '20 Daily Chart
Agricultural - Bullish Canola Count Intact Above Minimum 851.5

Posted on Oct 14, 2022, 07:42 by Dave Toth

On the heels of mid-Sep-to-early-Oct's steeper, accelerated, 3rd-wave-looking recovery, the past week-and-a-half's boringly lateral chop is first considered a corrective/consolidative event that warns of a continuation of the uptrend that preceded it to new highs above 04-Oct's 891.0 high.  This count remains consistent with our broader base/correction/recovery count introduced in 13-Sep's Technical Blog following that day's bullish divergence in short-term momentum above 07-Sep's 809.5 minor corrective high detailed in the hourly chart below.

The important takeaway from this month's lateral, sleepy price action is the definition of Wed's 851.5 low as the end or lower boundary of a suspected 4th-Wave correction.  A failure below 851.5 will confirm a bearish divergence in daily momentum and defer or threaten a bullish count enough to warrant non-bullish decisions like long-covers.  A failure below 851.5 will not necessarily negate a broader bullish count, but it will threaten it enough to warrant defensive measures as the next pertinent technical levels below 851.5 are 13-Sep's prospective minor 1st-Wave high at 813.8 and obviously 08-Sep's 766.0 low.  And making non-bullish decisions "down there" is sub-optimal to say the least.  Per such, both short- and longer-term commercial traders are advised to pare or neutralize bullish exposure on a failure below 851.5, acknowledging and accepting whipsaw risk- back above 04-Oct's 891.0 high- in exchange for much deeper and sub-optimal nominal risk below 766.0.

On a broader scale, the daily log scale chart above shows the developing potential for a bearish divergence in daily momentum that will be considered confirmed below 851.5.  This chart also shows the past month's recovery thus far stalling in the immediate neighborhood of the (888.0) Fibonacci minimum 38.2% retrace of Apr-Sep's entire 1128 - 766 decline).  COMBINED with a failure below 851.5, traders would then need to be concerned with at least a larger-degree correction pf the past month's rally and possibly a resumption of Apr-Sep's major downtrend.

Until and unless the market fails below 851.5 however, we would remind longer-term players of the key elements on which our bullish count is predicated:

  • a confirmed bullish divergence in WEEKLY momentum (below) amidst
  • an historically low 11% reading in out RJO Bullish Sentiment Index and
  • a textbook complete and major 5-wave Elliott sequence down from 29-Apr's 1128 high to 08-Sep's 766.0 low.

Thus far, the market is only a month into correcting a 4-MONTH, 32% drawdown, so further and possibly protracted gains remain well within the bounds of a major (suspected 2nd-Wave) correction of Apr-Sep's decline within an even more massive PEAK/reversal process from 17-May's 1219 high on an active continuation basis below.

These issues considered, a bullish policy and exposure remain advised with a failure below 851.5 required to defer or threaten this call enough to warrant moving to a neutral/sideline position.  In lieu of such weakness, we anticipate a continuation of the past month's rally to new highs and potentially significant gains above 891.0.

Agricultural - Grain Futures Update w/Stephen Davis - 10/02/2020
Stephen Davis discusses the latest news driving the grain markets. Stocks are currently tighter which may drive corn prices higher.
Equity - Stocks Fall After President Trump Tests Positive for Coronavirus

U.S. stock futures were trading sharply lower this morning on President Trump’s announcement that he tested positive for Covid-19, this coming on a day when the last job report before the election was to be the big news.  The Dow was down nearly 400 pts and the S&P 500 and Nasdaq were headed for even bigger losses on the open as traders reel on what this means for the upcoming election and the new economic stimulus plan.  “Markets (being impersonal) will focus on whether this affects the election outcome or public health policy,” UBS economist Paul Donovan said in a note Friday.  ‘The future presidential debates may not happen; these were not seen as especially significant. Those opposed to mask-wearing may revise their views, and the president’s experience may impact US public health policy.”

The Labor Department released this morning that nonfarm payrolls rose by a lower than expected 661,000 and the unemployment rate was listed at 7.9 %, the last number before the election.  Projections were a gain of 800,000 and rate of 8.2%.  This payroll miss was largely due to a drop in government hiring as home schooling continues.

E-mini S&P 500 Dec '20 Daily Chart
If you have any questions or would like to discuss the markets further, please feel free to contact me at 888-861-1656 or jyasak@rjofutures.com.
Economy - S-T Mo Failure Insufficient to End RBOB Correction, But Beware

Posted on Nov 08, 2022, 07:51 by Dave Toth

In Fri's Technical Webcast we identified a minor corrective low at 2.6328 from Thur as a mini risk parameter the market needed to sustain gains above to maintain a more immediate bullish count.  The 240-min chart below shows the market's failure overnight below this level, confirming a bearish divergence in very short-term momentum.  This mo failure defines Fri's 2.8172 high as one of developing importance and a parameter from which very short-term traders can objectively base non-bullish decisions like long-covers.

Given the magnitude of the past three weeks' broader recovery however, this short-term momentum failure is of an insufficient scale to conclude anything more than another correction within this broader recovery from 26-Sep's 2.1877 low.  Indeed, overnights failure below 2.6328 only allows us to conclude the end of the portion of the month-and-a-half rally from 31-Oct's 2.4822 next larger-degree corrective low.  2.4822 is the risk parameter this market still needs to fail below to break the uptrend from 18-Oct's 2.3526 low while this 2.3526 low remains intact as the risk parameter this market needs to fail below to break the month-and-a-half uptrend.  From an intermediate-to-longer-term perspective, this week's setback falls well within the bounds of another correction ahead of further gains.  This is another excellent example of the importance of technical and trading SCALE and understanding and matching directional risk exposure to one's personal risk profile.

The reason overnight's admittedly minor mo failure might have longer-term importance is the 2.8172-area from which it stemmed.  In Fri's Technical Blog we also noted the market's engagement of the 2.8076-to-2.8159-area marked by the 61.8% retrace of Jun0-Sewp's 3.2758 -2.1877 decline and the 1.000 progression of Sep-Oct's initial 2.1877 - 2.6185 (suspected a-Wave) rally from 18-Oct's 2.3526 (suspected b-Wave) low.  We remind longer-term players that because of the unique and compelling confluence of:

  • early-Aug's bearish divergence in WEEKLY momentum amidst
  • historically extreme bullish sentiment/contrary opinion levels in our RJO Bullish Sentiment Index
  • an arguably complete and massive 5-wave Elliott sequence from Mar'20's 0.4605 low to Jun's 4.3260 high (as labeled in the weekly log active-continuation chart below) and
  • the 5-wave impulsive sub-division of Jun-Sep's (suspected initial 1st-Wave) decline

The recovery attempt from 26-Sep's 2.1877 low is arguably only a 3-wave (Wave-2) corrective rebuttal to Jun-Sep's decline within a massive, multi-quarter PEAK/reversal process.  Now granted, due to the magnitude of 2020 -2022's secular bull market, we discussed the prospect for this (2nd-Wave corrective) recovery to be "extensive" in terms of both price and time.  A "more extensive" correction is typified by a retracement of 61.8% or more and spanning weeks or even months following a 3-month decline.  Per such, the (suspected corrective) recovery from 26-Sep's 2.1877 low could easily have further to go, with commensurately larger-degree weakness than that exhibited this week (i.e., a failure below at least 2.4822) required to consider the correction complete.  Indeed, the daily log chart above shows the market thus far respecting former 2.6185-area resistance from 10-Oct as a new support candidate.

These issues considered, very shorter-term traders have been advised to move to a neutral/sideline position following overnight's momentum failure below 2.6328, with a recovery above 2.8172 required to negate this call, reaffirm the recovery and re-expose potentially significant gains thereafter.  For intermediate- and longer-term players, a bullish policy and exposure remain advised with a failure below 2.4822 required to threaten this call enough to warrant neutralizing exposure.  We will be watchful for another bearish divergence in momentum following a recovery attempt that falls short of Fri's 2.8172 high that would be considered the next reinforcing factor to a count calling that 2.8172 high the prospective end to the month-and-a-half 2nd-Wave correction.  In lieu of such, a resumption of the current rally to eventual new highs above 2.8172 should not surprise.

Economy - Futures Market Forecast w/John Caruso - 10/02/202

Well, welcome to Q4 2020 I suppose….

Yesterday our Implied Vol signals were flashing -6% in the Nasdaq which put it in the 95% percentile of “complacency” on a 10yr look back. Volume also declined on yesterday’s punch higher in stocks, another signal that the “big” money had little conviction at those price points. The President contracting Covid-19 or not, we still think there was a high likely hood of waking up to a morning such as this. Copper prices fell -5.5% yesterday, along with Oil’s -3.5% plunge – two economic bellwether commodities collapsing like that intraday is usually a sign of trouble. We bought bonds yesterday, rather than shorting stocks – which was the correct call. The 10yr yield has backed off approximately 6 bps from yesterday’s open, giving us a nice bounce in the 10yr Notes.  Albeit, not a good thing having the leader of the free World Covid-positive, we still think the stimulus bill is likely a more important factor for markets in the near-term. Yesterday we took our first steps in positioning for “Risk-off” in Q4 2020.

Sept Non-Farm Payrolls aka Employment Report: 661K jobs created vs 868K expected; 7.9% UE rate vs 8.2% expected

Global Equities:
USA: Sp500 -1.47%; NQ -2.08%; RTY -1.68%

EUR: GER -1.10%, UK -0.88%, FRA -0.88%

Asia: Shanghai -0.20%, KOSPI +0.86%

VIX: Signaling immediate overbought overnight to the top of the range.  >10% bounce in the VIX last night. 

Commodities Overnight:

Metals: Gold/Silver flat following a volatile overnight session. Gold may have some more “gas” in the tank, however we still are of the strong opinion that the US Dollar may attempt to reverse higher in the near-term providing us better entry points in Gold. 

Copper: The “Dr” got trashed yesterday -5.5% signaling impending doom – and it was correct. Copper is a top long in Scenario 3, but that’s in the past now. We expect Copper to underperform going forward. 

Oil- down -4.29% overnight to 37.00, now signaling immediate oversold, but flipped back to BEARISH TREND yesterday

Agriculture:
Soybeans down -0.88%

Corn down -1.18%

Coffee down -0.93%

Sugar down -1.60%

Looks like a risk off equity/commodity basket to me.  Good Luck today, plenty to do.  We’ll be in touch.

If you have any questions or would like to discuss the markets further, please feel free to contact me at 800-669-5354 or jcaruso@rjofutures.com.

Coming Up Next Week...

View Futures Calendar