How technical analysis differs from trading strategy
Why is price action so important
How to implement a trading strategy
New: Election Special Report
Historically, we have seen volatility increase around elections and heading into the end of the year. For instance, after the election in 2016, equity futures fell by 4% overnight. When you factor in the residual effects from Covid-19 and everything else going on right now, this year is expected to be even more volatile. Learn how to protect your investments and hedge against a possible downturn with this special report!
The Markets
Metals - Gold Trading Sideways Heading Into Election
Gold Trading Sideways Heading Into Election
By: Frank J. Cholly, Senior Market StrategistPosted Oct 30, 2020 8:55AM CT
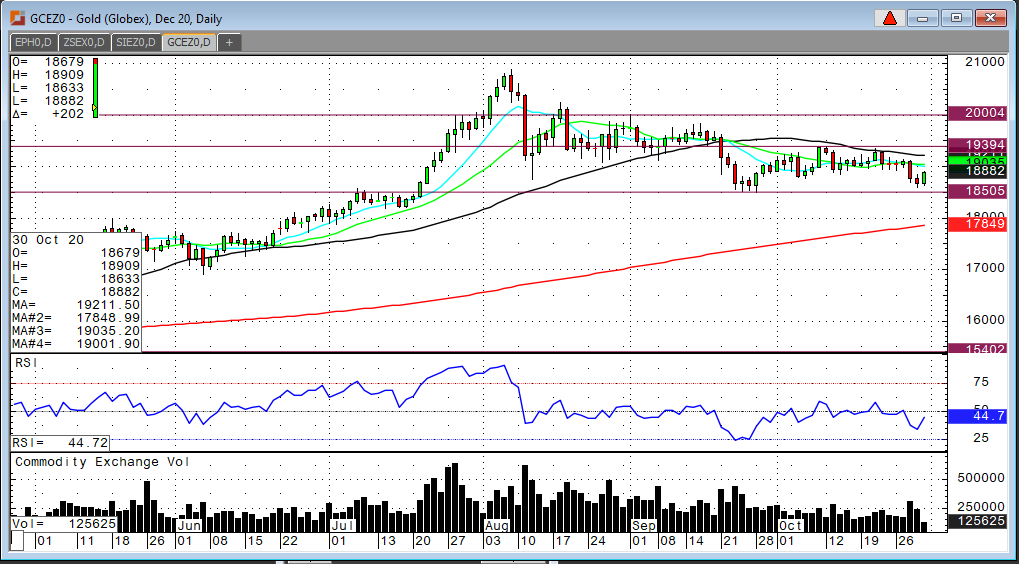
Gold futures have not been able to break out of the sideways channel since mid-August. The Congress failed to put together a “stimulus” package that both sides could agree on. Gold traders showed their disappointment by selling gold. Of course, the US Dollar rallied on that same news but fails to hold levels above .9400. At the same time gold is reluctant to trade below $1,850. Now we’re just a hand full of days away from the Election and while I do believe there will likely be a huge whipsaw type of trading event on November 3rd, I also see gold breaking out above $2,000. Fiscal stimulus, Dollar weakness, rising debt and “keep rates low for long” has not gone away! Ultimately gold moves higher. Not to mention that this current environment undoubtedly leads to inflation. There’s no way around it if President Trump does get re-elected. The economy is showing signs of life. The economy will come back. We’re going to look back a year from now and say, “I should’ve bought more gold below $1,900!”
Gold Dec '20 Daily Chart If you have any questions or would like to discuss the markets further, please feel free to contact me at 800-826-4124 or fcholly@rjofutures.com. Metals - Silver Waiting on Election
Silver Waiting on Election
By: Eli Tesfaye, Senior Market StrategistPosted Oct 30, 2020 10:42AM CT
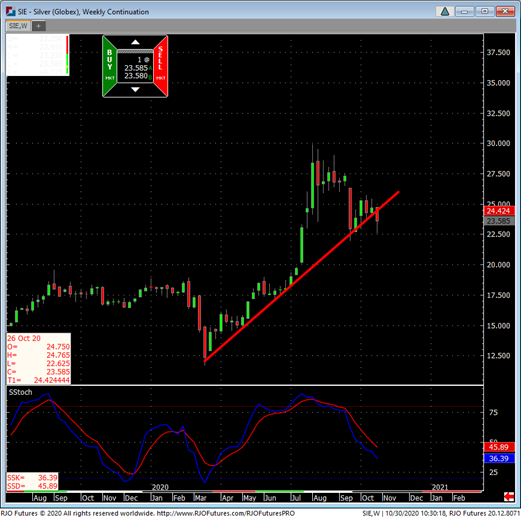
Dec. silver is trading around 23.64, up about 27.0 cents as I write today. A weak US dollar provided a bit of a lift for silver, but silver struggled to hold that gain. It will take a sustained rally to repair the chart damage done to the downside from the technical perspective. Infact a break above 24.50 will be needed to sustain any really and entice bulls to come in. a break below 23.00 will signal more corrective, possibly short-term, price action.
The US election is just a few days away, will there be more volatility? It remains to be seen. There is a lot of price actions anticipated around the US election. In my view, regardless of who wins, markets will be looking to digest any significant type of stimulus to continue to support the economy.
Again, it is impressive that the bears continue to keep silver in check. The more significant problem the US faces will be a deflationary/rescission type of environment, which would be challenging to justify any higher silver prices.
Even with the dollar weakness, the technical still favor the bears.
Silver Weekly Chart If you have any questions or would like to discuss the markets further, please feel free to contact me at 800-367-7290 or etesfaye@rjofutures.com. Energy - Oil Sharply Lower on Lockdown Measures
Oil Sharply Lower on Lockdown Measures
By: Alex Turro, Senior Market StrategistPosted Oct 30, 2020 9:31AM CT
Oil prices are edging lower here in the early session, extending the weeks losses amidst a continuing surge in coronavirus cases throughout Europe and the United States as the market assess the impact on global consumption and fuel demand. France and Germany announced new lockdown measures on Wednesday, souring sentiment and adding to the already fragile demand outlook. OPEC+ are expected to raise output by 2 million bpd in January, despite top producers Russia and Saudi Arabia inclined to maintain the current output of 7.7 million bpd. This comes as Libya has continued to increase production and is expected to reach 1 million bpd in the coming weeks. OPEC+ are scheduled to meet Nov. 30 and Dec. 1 to assess policy. Weekly inventories showed a surprise increase according to the EIA, signaling ample supply despite gasoline consumption continuing to falter. Despite oil poised for its worst week since April, the volatility of oil is suggesting that the selling could be drying up on any renewed Dollar weakness. The market remains bearish trend with today’s range seen between 35.88 – 39.70.
Oil Dec '20 Daily Chart If you have any questions or would like to discuss the markets further, please feel free to contact me at 800-438-4805 or aturro@rjofutures.com. Softs - Covid-19 Lockdowns, Lack of Demand, Plus Election Moves Cocoa Lower
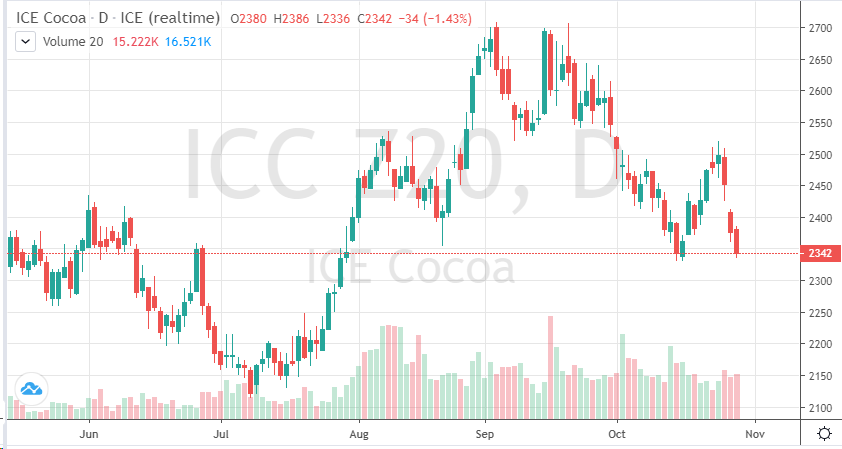
Covid-19 Lockdowns, Lack of Demand, Plus Election Moves Cocoa Lower
By: Peter MoosesPosted 10/30/2020
Looking
at a December cocoa contract, traders see the gap formed earlier this week –
will that be filled? As we approach the weekend, Ivory Coast’s Presidential
election is set to take place. Many people are anticipating political unrest
and potential boycotts. As this occurs and supply issues arise from port
closure or disruptions, prices continue to move lower.
The
eurocurrency remains weak as lockdowns take affect in certain regions. Relief
doesn’t appear close to an already demand dependent cocoa market. As new
measures are put into place in Europe, demand continues to weaken as we head
into a key time of year for the cocoa market. Typically, data from corporations
show a boost in demand over he next few months, not during a pandemic though.
The U.S. Presidential election has the global markets on edge, waiting for the results next week will be sure to add movement commodities. Fundamentals will vary from day to day over the next week, but technical levels may hold, look at option strategies to gain limited exposure to the market during an uncertain time.
On
the heels of mid-Sep-to-early-Oct's steeper, accelerated, 3rd-wave-looking
recovery, the past week-and-a-half's boringly lateral chop is first considered
a corrective/consolidative event that warns of a continuation of the uptrend
that preceded it to new highs above 04-Oct's 891.0 high. This count
remains consistent with our broader base/correction/recovery count introduced
in 13-Sep's Technical Blog following that
day's bullish divergence in short-term momentum above 07-Sep's 809.5 minor
corrective high detailed in the hourly chart below.
The
important takeaway from this month's lateral, sleepy price action is the
definition of Wed's 851.5 low as
the end or lower boundary of a suspected 4th-Wave correction. A failure
below 851.5 will confirm a bearish divergence in daily momentum and defer or
threaten a bullish count enough to warrant non-bullish decisions like
long-covers. A failure below 851.5 will not
necessarily negate a broader bullish count, but it will threaten it enough to
warrant defensive measures as the next pertinent technical levels below 851.5 are
13-Sep's prospective minor 1st-Wave high at 813.8 and obviously 08-Sep's 766.0
low. And making non-bullish decisions "down there" is
sub-optimal to say the least. Per such, both short- and longer-term
commercial traders are advised to pare or neutralize bullish exposure on a
failure below 851.5, acknowledging and accepting whipsaw risk- back above 04-Oct's
891.0 high- in exchange for much deeper and sub-optimal nominal risk below
766.0.
On
a broader scale, the daily log scale chart above shows the developing potential
for a bearish divergence in daily momentum that will be considered confirmed
below 851.5. This chart also shows the past month's recovery thus far
stalling in the immediate neighborhood of the (888.0) Fibonacci
minimum 38.2% retrace of Apr-Sep's entire 1128 - 766 decline). COMBINED
with a failure below 851.5, traders
would then need to be concerned with at least a larger-degree correction pf the
past month's rally and possibly a resumption of Apr-Sep's major downtrend.
Until
and unless the market fails below 851.5 however, we would
remind longer-term players of the key elements on which our bullish count is
predicated:
a confirmed bullish divergence in WEEKLY momentum
(below)
amidst
an
historically low 11% reading in out RJO Bullish Sentiment Index and
a
textbook complete and major 5-wave Elliott sequence down from 29-Apr's
1128 high to 08-Sep's 766.0 low.
Thus
far, the market is only a month into correcting a 4-MONTH, 32% drawdown, so
further and possibly protracted gains remain well within the bounds of a major
(suspected 2nd-Wave) correction of Apr-Sep's decline within an even more
massive PEAK/reversal process from 17-May's 1219 high on an active continuation
basis below.
These
issues considered, a bullish policy and exposure remain advised with a failure
below 851.5 required to defer or threaten this call enough to warrant moving to
a neutral/sideline position. In lieu of such weakness, we anticipate a
continuation of the past month's rally to new highs and potentially significant
gains above 891.0.
Agricultural - Grain Futures Update w/Stephen Davis - 10/30/2020
Grain Futures Update w/Stephen Davis - 10/30/2020
By: Stephen DavisPosted 10/30/2020
Stephen Davis discusses the latest news moving the grain markets and things are starting to get quite interesting ahead of Tuesday's election.Agricultural - Live Cattle Seeing a Nice Rally
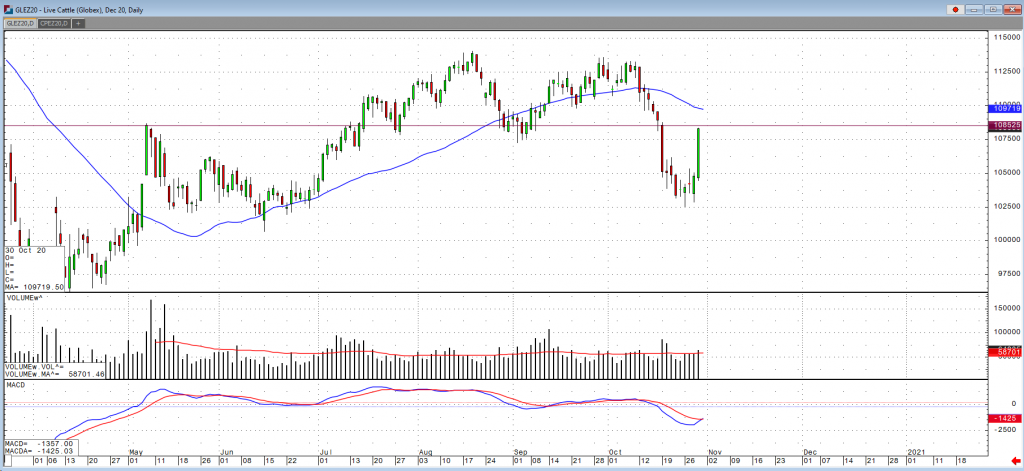
Live Cattle Seeing a Nice Rally
By: Peter McGinnPosted 10/30/2020
Dec cattle, and the cattle market as a whole experienced a
nice rally yesterday with the December contract closing at 108.30. If we do get
some follow through today, the market will run into some pretty strong
resistance at these 108.50 levels. If it breaks though that, with above average
volume I would then look go long. What was helping this little rally yesterday
was a more stable cash trade, as cash was mixed from lower, unchanged, and
higher prices but also the slowdown in production has helped boost prices as
well. Exports seemed to have been a bullish report as well as you can see in
the numbers below. With increased virus concerns though and potentially more
cities and countries shutting down do to COVID, we could see demand drop
drastically again resulting to a fall in prices.
The USDA boxed beef cutout was up $1.50 at mid-session yesterday and closed $1.38 higher at $207.17. This was down from $208.86 the previous week. US beef export sales for the week ending October 22 came in at 18,853 tonnes for 2020 delivery and 4,594 for 2021 for 23,447. This was down slightly from the previous week's 24,307 but above the average of the previous four weeks at 21,756. Cumulative sales for 2020 have reached 838,038 tonnes, up from 797,428 last year at this time but down from 840,150 two years ago. The five-year average is 714,885. The largest buyer this week was Japan at 6,907 tonnes for 2020 and 2021 combined, followed by South Korea at 5,258 and China at 4,280. Japan has the largest commitments for 2020 at 242,381 tonnes, followed closely by South Korea at 227,612. China is in sixth place at 47,109. The USDA estimated cattle slaughter came in at 114,000 head yesterday. This brings the total for the week so far to 464,000 head, down from 480,000 last week and 465,000 a year ago.
Live Cattle Dec '20 Daily ChartEquity - E-mini S&P 500 End of Week Update
E-mini S&P 500 End of Week Update
By: Adam TuiaanaPosted 10/30/2020
Adam provides and end of week update on the S&P 500 and gives insight as to what to expect in the markets with the upcoming electionEquity - Stock Futures Moving with Election
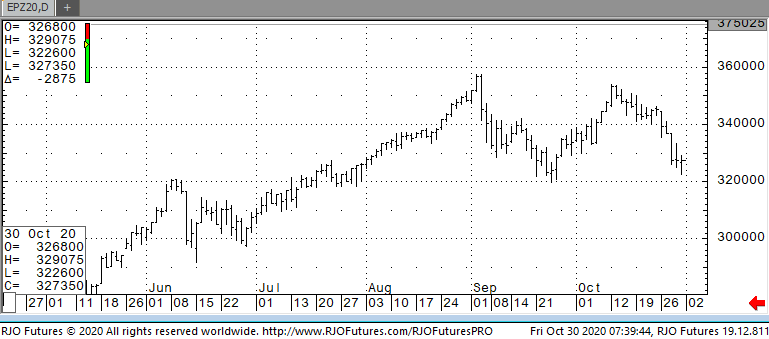
Stock Futures Moving with Election
By: Jeff Yasak, Senior Market StrategistPosted Oct 30, 2020 9:16AM CT
U.S. stock futures are trading lower this morning giving back gains seen on Thursday’s trading. Even with yesterday’s gains, stocks are still poised for a steep decline this week with the S&P down 4.5%, the Dow 5.9%, and Nasdaq 3%. This week’s downturn was mainly due to new coronavirus fears throughout Europe and the U.S. Germany and France has once again taken extreme measures to slow the spread with Germany even imposing a full shutdown for four weeks. In the U.S., almost all states have seen a jump in hospitalizations and deaths creating fear of another shutdown. Even if a shutdown doesn’t occur the fear is slowing spending and activities creating problems for many business sectors. This morning also showed some reports from big tech companies adding concerns to a slowing economy. Apple reported very low sales of its iconic iPhone and Twitter missed its growth estimate to name a few. This will add volatility to the market that will keep rising going into next week’s election.
Support today is 324500 and 320500 with resistance showing 333000 and 337500.
E-mini S&P 500 Dec '20 Daily Chart If you have any questions or would like to discuss the markets further, please feel free to contact me at 888-861-1656 or jyasak@rjofutures.com. Economy - S-T Mo Failure Insufficient to End RBOB Correction, But Beware
S-T Mo Failure Insufficient to End RBOB Correction, But Beware
By: RJO Market InsightsPosted 11/08/2022
Posted on Nov 08, 2022, 07:51 by Dave Toth
In Fri's Technical Webcast we identified a
minor corrective low at 2.6328 from Thur as a mini risk parameter the market
needed to sustain gains above to maintain a more immediate bullish count.
The 240-min chart below shows the market's failure overnight below this level,
confirming a bearish divergence in very short-term momentum. This mo
failure defines Fri's 2.8172 high as
one of developing importance and a parameter from which very short-term traders
can objectively base non-bullish decisions like long-covers.
Given
the magnitude of the past three weeks' broader recovery however, this
short-term momentum failure is of an insufficient scale to conclude anything
more than another correction within this broader recovery from 26-Sep's 2.1877
low. Indeed, overnights failure below 2.6328 only allows us to conclude
the end of the portion of the month-and-a-half rally from 31-Oct's 2.4822 next
larger-degree corrective low. 2.4822 is the
risk parameter this market still needs to fail below to break the uptrend from
18-Oct's 2.3526 low while this 2.3526 low
remains intact as the risk parameter this market needs to fail below to break
the month-and-a-half uptrend. From an
intermediate-to-longer-term perspective, this week's setback falls well within
the bounds of another correction ahead of further gains. This is another
excellent example of the importance of technical and trading SCALE and
understanding and matching directional risk exposure to one's personal risk
profile.
The
reason overnight's admittedly minor mo failure might have longer-term
importance is the 2.8172-area from which it stemmed. In
Fri's Technical Blog we also noted the market's engagement of the
2.8076-to-2.8159-area marked by the 61.8% retrace of Jun0-Sewp's 3.2758 -2.1877
decline and the 1.000 progression of Sep-Oct's initial 2.1877 - 2.6185
(suspected a-Wave) rally from 18-Oct's 2.3526 (suspected b-Wave) low. We
remind longer-term players that because of the unique and compelling confluence
of:
early-Aug's bearish divergence in WEEKLY momentum
amidst
historically
extreme bullish sentiment/contrary opinion levels in our RJO Bullish
Sentiment Index
an
arguably complete and massive 5-wave Elliott sequence from Mar'20's 0.4605
low to Jun's 4.3260 high (as labeled in the weekly log active-continuation
chart below) and
the
5-wave impulsive sub-division of Jun-Sep's (suspected initial 1st-Wave) decline
The
recovery attempt from 26-Sep's 2.1877 low is arguably only a 3-wave (Wave-2)
corrective rebuttal to Jun-Sep's decline within a massive, multi-quarter
PEAK/reversal process. Now granted, due to the magnitude of 2020 -2022's
secular bull market, we discussed the prospect for this (2nd-Wave corrective)
recovery to be "extensive" in terms of both price and time. A
"more extensive" correction is typified by a retracement of 61.8% or
more and spanning weeks or even months following a 3-month decline. Per
such, the (suspected corrective) recovery from 26-Sep's 2.1877 low could easily
have further to go, with commensurately larger-degree weakness than that
exhibited this week (i.e., a failure below at least 2.4822) required
to consider the correction complete. Indeed, the daily log chart above
shows the market thus far respecting former 2.6185-area resistance from 10-Oct
as a new support candidate.
These
issues considered, very shorter-term traders have been advised to move to a neutral/sideline
position following overnight's momentum failure below 2.6328, with a recovery
above 2.8172 required to negate this call, reaffirm the recovery and re-expose
potentially significant gains thereafter. For intermediate- and
longer-term players, a bullish policy and exposure remain advised with a
failure below 2.4822 required to threaten this call enough to warrant
neutralizing exposure. We will be watchful for another bearish divergence
in momentum following a recovery attempt that falls short of Fri's 2.8172 high
that would be considered the next reinforcing factor to a count calling that
2.8172 high the prospective end to the month-and-a-half 2nd-Wave
correction. In lieu of such, a resumption of the current rally to
eventual new highs above 2.8172 should not surprise.
Economy - Futures Market Outlook w/John Caruso - 10/30/2020
Futures Market Outlook w/John Caruso - 10/30/2020
By: John Caruso, Senior Market StrategistPosted Oct 30, 2020 9:03AM CT
“Clouds are not spheres, mountains are not cones, coastlines
are not circles, bark is not smooth, nor does lightning travel in a straight
line.” – Benoit Mandelbrot
That’s a quote by BM, the father of fractal geometry.
While its human nature to look for linearity in a non-linear world, its just
not that simple. Whether you want to subscribe to chaos theory or fractal
geometry theory, there’s certainly many intersections, and both are highly
correlated to the current mood of the market. Yes, this week was most
certainly a “risk-off” week in markets, while we’re looking for more
stagflation – there’s been plenty of hemming and hawing over that, and I get
it. As we walk a tightrope between the probability of stagflation and
risk off Scenario’s, I’ll simply use my market range analysis to help me
navigate.
USA: SPY -0.92%, NQ -1.25%, RTY -0.85% EUR: GER -0.53%, UK -0.30%, FRA +0.09% Asia: Shanghai -1.47%, KOSP -2.56%
Asian equities are getting pounded overnight, following the
USA’s collapse late in the day following big tech earnings, and AAPLs downbeat
look on iPhone sales. A few day’s back, David Einhorn of Greenlight
Capital warned in his Q3 letter to investors that “we’re in the midst of an
epic tech bubble”.
Implied Vols remain at strong PREMIUMS – translation: the Street was prepared for this episode of volatility.
Volatility: The VIX spiked north of 40 this week, and
the VXN (Nasdaq Vol) to 43.50. Is this the beginning of a trend or just
another episodic battle with volatility? We think its likely the latter,
as we’ll eventually begin to reposition and “prepare to compare” the y/y data
in Q1 2021 vs the Pandemic data of 2020. But we’re certainly not ready to
skip ahead to that chapter just yet.
Commodities have regained some lost ground, particularly the
metals:
Gold +0.50%, Silver +0.90%, Platinum +0.55%
Risk assets got dumped on in a big way this week. The US
Dollar reflated 1.0%, and the bond market has broken out into a higher trading
range. The mood of the market is certainly that of a different tone than we’ve
been trained to subscribe too for the past several months, and the asymmetry of
the risk environment that we’re currently in may be like nothing we’ve ever
seen before. Early next week I’ll do a weekly look back on the percentage
changes in risk assets and what to prepare for as next week transpires.
Keep calm and carry on, because next week could be a doozy. An oh yeah,
Non-Farm Payrolls is due at the end of next week. Buckle up.
If you have any questions or would like to discuss the markets further, please feel free to contact me at 800-669-5354 or jcaruso@rjofutures.com.