Discover how options are priced and learn to read option quotes
How to trade rising and falling markets using options
RJO Echo Trading is Here!
Attention New or Frustrated Traders:
Do you want to get into futures trading, but don’t have the time or knowledge necessary to do so? If yes, then RJO Echo Trading is for you. RJO Echo Trading is an intuitive way for investors or “echo followers” to automatically match the performance of veteran and accomplished traders. As an “Echo Follower” you will choose from a selection of proven, vetted, and experienced “Echo Leaders”, all you have to do is a pay a subscription fee and your account will mimic the trades of your chosen “Leader”. Echo Trading eliminates the learning curve needed to trade futures, making it an option for all.
The Markets
Metals - Gold In the Middle of a Tug of War
Gold In the Middle of a Tug of War
By: Joshua GravesPosted 11/22/2019
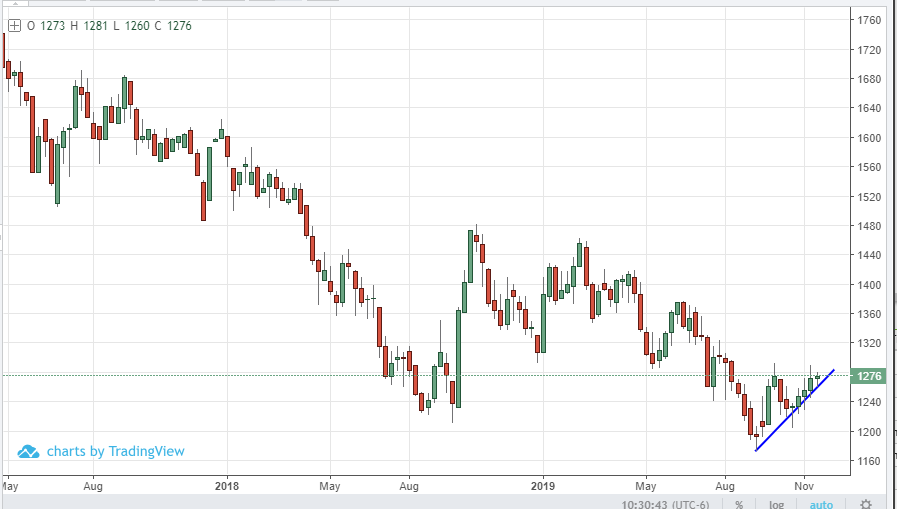
If we look at how February gold has traded over the past few
weeks, it should come as no surprise that a stock market rally has pressured
the precious metals market in a big way. Full disclosure, I don’t see gold
going beneath 1425 over the next month, but I absolutely do not see gold
rallying back to contract highs either. I think that the market sentiment as a
whole is mainly three categories that are all playing tug of war with gold.
The first would be the gold bulls who think that the trade
talks will collapse any day, Trump will be impeached, and the stock market is
going to be down double digit percentage points. The second category would be
the gold bears who believe the stock market is strong, manufacturing data this
morning proves that, and company earnings continue to blow away expectations.
The third is a category that I fall into where logic dictates that there is
plenty of uncertainty to keep Feb gold well supported from 1425 to 1450, but
not strong enough to run back the mid 1500’s. Market sentiment and the
technicals are what I am watching right now, and gold should continue lower to
around 1435. This is the sweet spot I am shooting for, and if we were to trade
down to this level I think there is a great opportunity for metals traders as a
whole.
There are excellent ways to approach gold with deep liquidity in gold futures vs any ETF and options that are far superior to any gold ETF. Gold futures trade $29B worth every day compared to the most popular gold ETF (GLD) with just $1.1B trading every day as an example. .
Metals - Silver Waiting on Washington D.C.
Silver Waiting on Washington D.C.
By: Eli Tesfaye, Senior Market StrategistPosted Nov 22, 2019 9:41AM CT
The Dec silver contract is approaching expiration as open interest in March is picking up. March silver is now trading $17.195 flat on the day. The most newsworthy development in the past few days is that the U.S. is stepping up its presence in the south China sea. The deployment two of USS Gabrielle Giffords and USS Montgomery sends a signal to Beijing that these high powered advance fleets are capable of countermeasures that China may attempt. Also, with the house potentially passing impeachment and forcing the Senate to hold a hearing could give silver additional lift.
Later today, we will see the COT reading of fund positions in silver. In my view, any break should be bought rather than sold. The only real fear silver traders should have weaker economic readings in major powerhouses around the world.
Technical analysis shows on weekly contact that momentum favors bear camp in the near term; trade needs to close above $18.00 to encounter bear attach.
If you have any questions or would like to discuss the markets further, please feel free to contact me at 800-367-7290 or etesfaye@rjofutures.com. Energy - Crude Coming Off Two-Month High
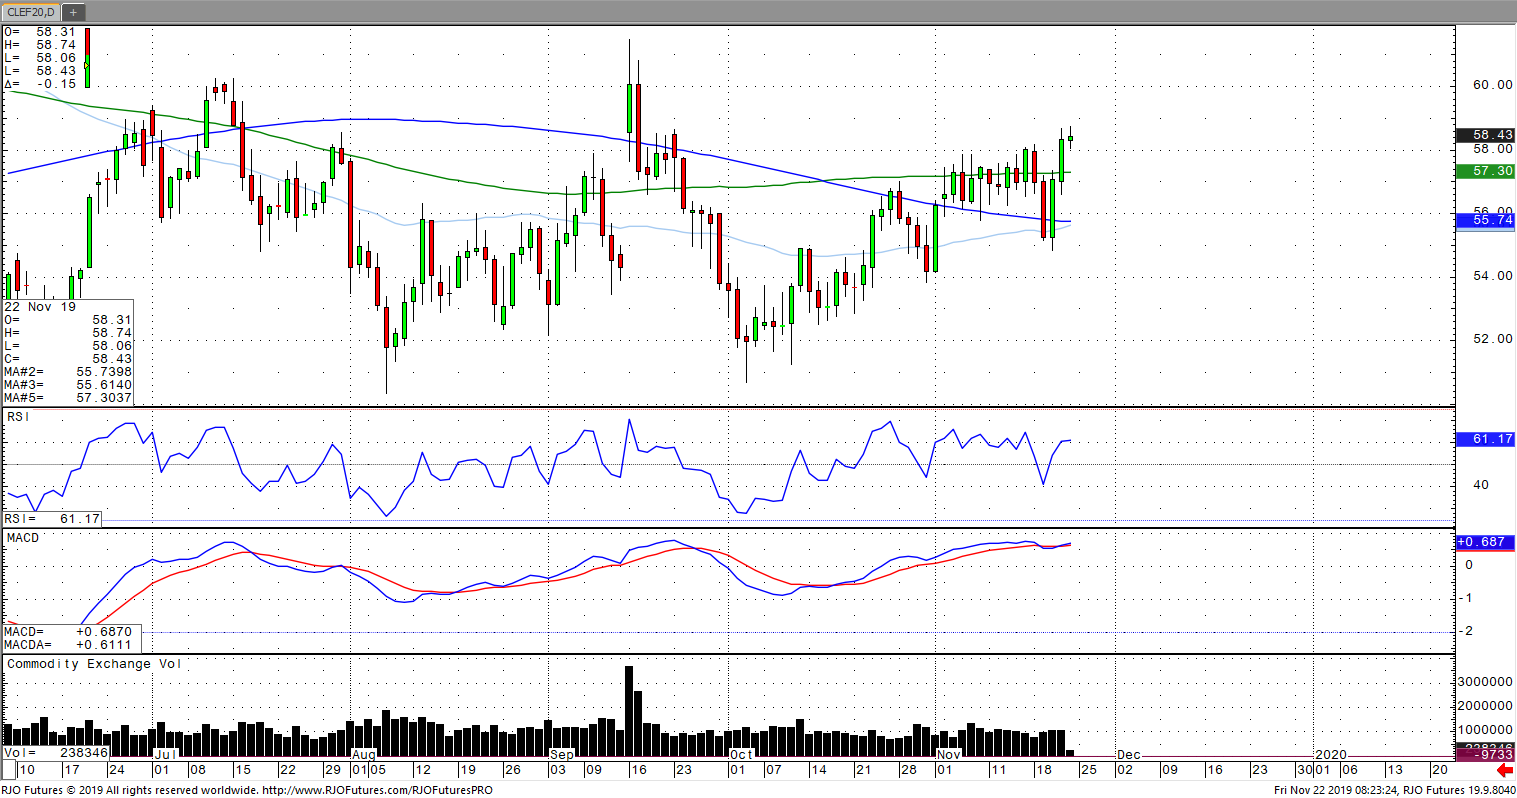
Crude Coming Off Two-Month High
By: Alexander Turro, Senior Market StrategistPosted Nov 22, 2019 8:47AM CT
Oil is coming off nearly a two month high following a range up upside breakout yesterday amidst continuing doubts of a partial trade deal between U.S.-China being made, which is weighing on global economic concerns. This comes following reports that OPEC and Russia are likely to extend production cuts until possibly mid 2020 following their meeting early December, with an emphasis on compliance from countries such as Iraq and Nigeria. The current arraignment is for a cut of 1.2 million bpd through the end of March. Weekly crude oil stocks came in on a 1.3-million barrel build, which was largely offset by the largest cushing decline since August. Given the aggressive rally in the last two consecutive sessions and the market now signaling immediate term overbought expect some corrective action in the near term with today’s range seen between 55.40 – 58.75.
If you have any questions or would like to discuss the markets further, please feel free to contact me at 800-438-4805 or aturro@rjofutures.com. Softs - Sugar Grinds Higher and Could Start to Rally
Sugar Grinds Higher and Could Start to Rally
By: Eric ScolesPosted 11/20/2019
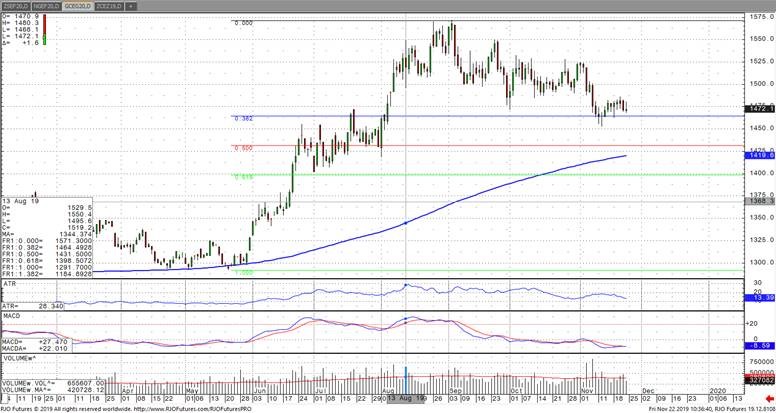
Mar ’20 Sugar futures continue to grind out higher prices despite negative outside market influences. Sugar is on track for its 5th week of gains with what is still a massive net spec short. The weekly charts show a clear trend in higher lows which indicates prices are well supported even with a recent sell-off in energies and the Brazilian real seeing 4-year lows. Reports continuously indicate an increasing global production deficit for 2019/20 from India, Thailand, Europe, and now the U.S. after recent storms. With prices already so low and a significant net spec short position, Sugar has a lot of fuel for a sustained rally, supported by strong fundamentals. My analysis suggests this market could see some exciting and impressive activity in the near-future.
On
the heels of mid-Sep-to-early-Oct's steeper, accelerated, 3rd-wave-looking
recovery, the past week-and-a-half's boringly lateral chop is first considered
a corrective/consolidative event that warns of a continuation of the uptrend
that preceded it to new highs above 04-Oct's 891.0 high. This count
remains consistent with our broader base/correction/recovery count introduced
in 13-Sep's Technical Blog following that
day's bullish divergence in short-term momentum above 07-Sep's 809.5 minor
corrective high detailed in the hourly chart below.
The
important takeaway from this month's lateral, sleepy price action is the
definition of Wed's 851.5 low as
the end or lower boundary of a suspected 4th-Wave correction. A failure
below 851.5 will confirm a bearish divergence in daily momentum and defer or
threaten a bullish count enough to warrant non-bullish decisions like
long-covers. A failure below 851.5 will not
necessarily negate a broader bullish count, but it will threaten it enough to
warrant defensive measures as the next pertinent technical levels below 851.5 are
13-Sep's prospective minor 1st-Wave high at 813.8 and obviously 08-Sep's 766.0
low. And making non-bullish decisions "down there" is
sub-optimal to say the least. Per such, both short- and longer-term
commercial traders are advised to pare or neutralize bullish exposure on a
failure below 851.5, acknowledging and accepting whipsaw risk- back above 04-Oct's
891.0 high- in exchange for much deeper and sub-optimal nominal risk below
766.0.
On
a broader scale, the daily log scale chart above shows the developing potential
for a bearish divergence in daily momentum that will be considered confirmed
below 851.5. This chart also shows the past month's recovery thus far
stalling in the immediate neighborhood of the (888.0) Fibonacci
minimum 38.2% retrace of Apr-Sep's entire 1128 - 766 decline). COMBINED
with a failure below 851.5, traders
would then need to be concerned with at least a larger-degree correction pf the
past month's rally and possibly a resumption of Apr-Sep's major downtrend.
Until
and unless the market fails below 851.5 however, we would
remind longer-term players of the key elements on which our bullish count is
predicated:
a confirmed bullish divergence in WEEKLY momentum
(below)
amidst
an
historically low 11% reading in out RJO Bullish Sentiment Index and
a
textbook complete and major 5-wave Elliott sequence down from 29-Apr's
1128 high to 08-Sep's 766.0 low.
Thus
far, the market is only a month into correcting a 4-MONTH, 32% drawdown, so
further and possibly protracted gains remain well within the bounds of a major
(suspected 2nd-Wave) correction of Apr-Sep's decline within an even more
massive PEAK/reversal process from 17-May's 1219 high on an active continuation
basis below.
These
issues considered, a bullish policy and exposure remain advised with a failure
below 851.5 required to defer or threaten this call enough to warrant moving to
a neutral/sideline position. In lieu of such weakness, we anticipate a
continuation of the past month's rally to new highs and potentially significant
gains above 891.0.
Agricultural - Grain Futures Update w/Stephen Davis - 11/22/2019
Grain Futures Update w/Stephen Davis - 11/22/2019
By: Stephen DavisPosted 11/22/2019
RJO Futures Senior Market Strategist, Stephen Davis discusses this week's movements in the grain markets. Stephen mentions the effect the completion of a Phase One Trade Deal with China could have on our domestic grains.Agricultural - Cattle Market Seems Bearish
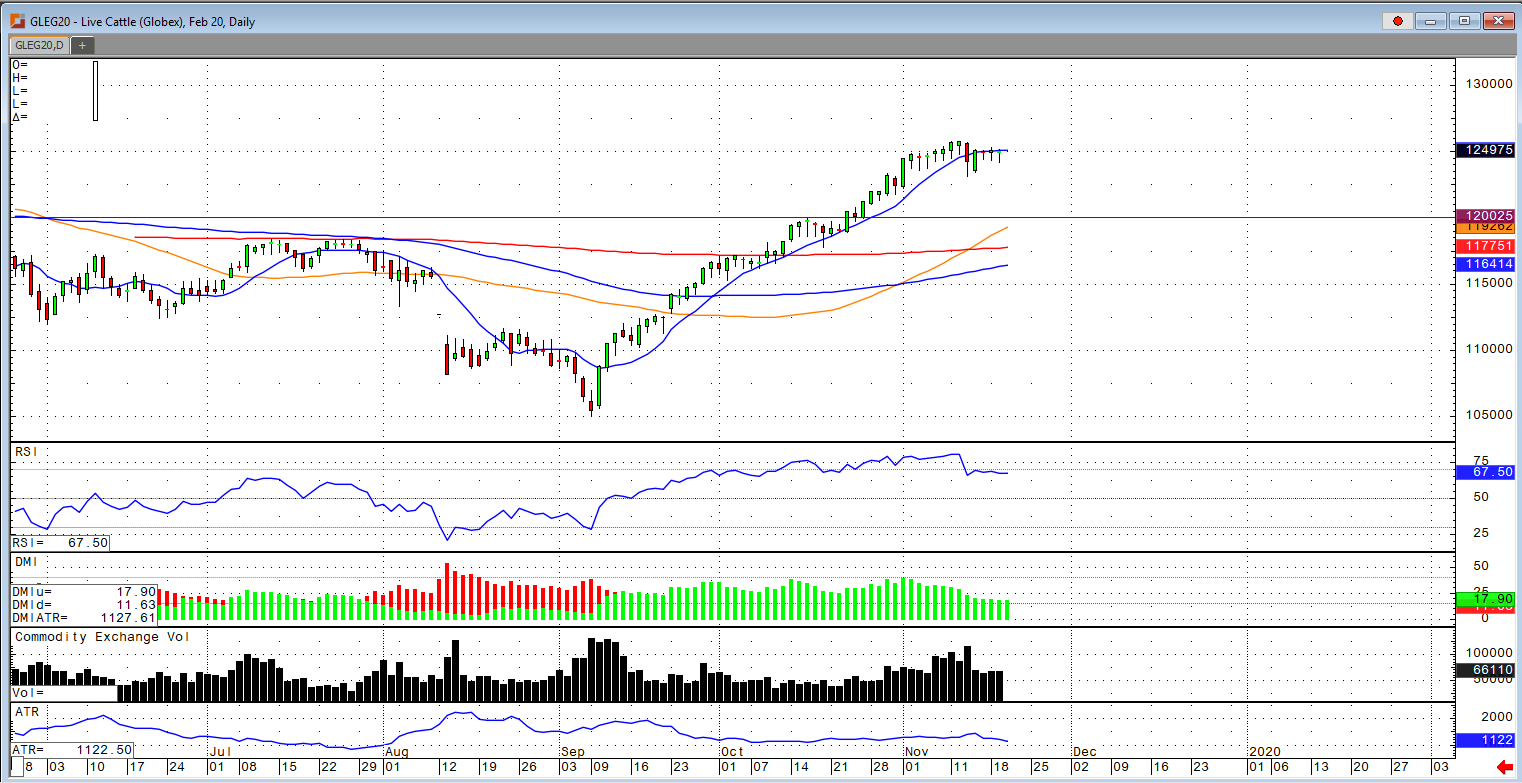
Cattle Market Seems Bearish
By: Peter McGinnPosted 11/20/2019
The cattle market looks a bit toppy to me right now. The estimates for the upcoming cattle on feed report came out and appear to be bearish, 101.4% is said to be the on-feed number, 112% for placed, and 99% for marketed. The higher placement number could be a bearish factor to the February and April contracts. February cattle is trading at nearly a $10 premium to the cash market with open interest continuing to trend upwards, but with a failure to close above the 10-day moving average and taking out the previous two trading session lows could signal the beginning of a turn to the downside in cattle. With the upcoming Cattle on Feed report and the large premium between the futures market to the cash, I see a market correction coming sooner rather than later with a $3-$5 dollar sell-off over the rest of the month into December. The USDA estimated cattle slaughter came in at 118,000 head yesterday. This brings the total for the week so far to 236,000 head, up from 231,000 last week, but down from 242,000 a year ago. USDA boxed beef cutout values were up 83-cents at mid-session yesterday and closed 11 cents lower at $239.01. This was down from $240.50 the prior week and the lowest beef market since November 11th. There has been no cash cattle trade in the plains so far this week but Iowa/Minnesota cattle traded at about $1.00 lower than last week to an average price of $115.61.
Currency - Currencies Chop Sideways as Trends Fight for Reversals
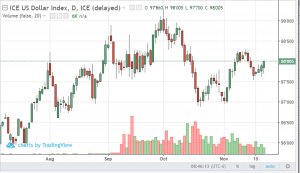
Currencies Chop Sideways as Trends Fight for Reversals
By: Ian BannonPosted 11/22/2019
U.S. dollar futures are modestly higher Friday morning, forging a fresh high for the week. Weekly scheduled data has not been overwhelmingly positive or negative, so it appears the bounce in the dollar index can be attributed to a breakdown in trade talks and technical support. The greenback is still in the grips of a strong bull trend on the weekly chart. Buying support has stepped in above critical trendlines and a double-bottom has reinforced support at the 97 level. The Japanese yen is carving out a bottom as well, drafting some support from a stronger-than-expected Japanese core CPI number. Given its “safe-haven” qualities, the yen is likely to hold support at 92.17 as long as trade tensions dominate headlines. European currencies are lower this week due to their strong inverse correlation to the dollar. Commodity currencies are rangebound. The Canadian dollar bounced off strong support at 75 this week and looks to move higher in the short term.
Equity - Do Stocks Know It's Christmas Time?
Do Stocks Know It's Christmas Time?
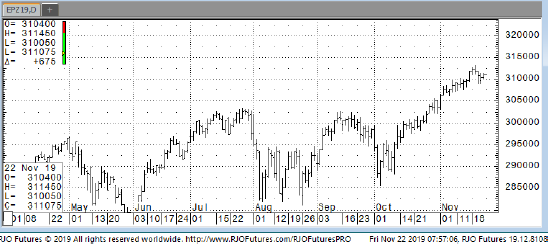
By: Jeff Yasak, Senior Market StrategistPosted Nov 22, 2019 8:44AM CT
U.S. stock futures were slightly higher Friday as the most recent comments from the Chinese government raised hopes of a deal after some inconsistent news pulled the market off its record highs. Earlier in the week there were reports that suggested that there could be a delay in the truce into next year, but Beijing has stated that it is willing to work out a deal “on the basis of mutual respect and equality”. Dec. 15th is a date to watch as this is when U.S. tariffs would kick in on Chinese goods that include holiday items such as Christmas decorations and electronic goods. Scott Brown, a chief economist at Raymond James, had stated “It’s less likely the deal will be signed by the end of the year, but you may see the Dec.15th tariffs postponed.”
Later this morning we will get a reading on the health of the consumer as the November’s consumer sentiment data will be released at 10:00 a.m. According to the University of Michigan, October’s number came in at 95.5. Higher readings indicate that consumers are more confident about current and future economic conditions.
Support today is checking in around 309200 and 3080 with resistance showing 311500 and 312700.
If you have any questions or would like to discuss the markets further, please feel free to contact me at 888-861-1656 or jyasak@rjofutures.com. Economy - S-T Mo Failure Insufficient to End RBOB Correction, But Beware
S-T Mo Failure Insufficient to End RBOB Correction, But Beware
By: RJO Market InsightsPosted 11/08/2022
Posted on Nov 08, 2022, 07:51 by Dave Toth
In Fri's Technical Webcast we identified a
minor corrective low at 2.6328 from Thur as a mini risk parameter the market
needed to sustain gains above to maintain a more immediate bullish count.
The 240-min chart below shows the market's failure overnight below this level,
confirming a bearish divergence in very short-term momentum. This mo
failure defines Fri's 2.8172 high as
one of developing importance and a parameter from which very short-term traders
can objectively base non-bullish decisions like long-covers.
Given
the magnitude of the past three weeks' broader recovery however, this
short-term momentum failure is of an insufficient scale to conclude anything
more than another correction within this broader recovery from 26-Sep's 2.1877
low. Indeed, overnights failure below 2.6328 only allows us to conclude
the end of the portion of the month-and-a-half rally from 31-Oct's 2.4822 next
larger-degree corrective low. 2.4822 is the
risk parameter this market still needs to fail below to break the uptrend from
18-Oct's 2.3526 low while this 2.3526 low
remains intact as the risk parameter this market needs to fail below to break
the month-and-a-half uptrend. From an
intermediate-to-longer-term perspective, this week's setback falls well within
the bounds of another correction ahead of further gains. This is another
excellent example of the importance of technical and trading SCALE and
understanding and matching directional risk exposure to one's personal risk
profile.
The
reason overnight's admittedly minor mo failure might have longer-term
importance is the 2.8172-area from which it stemmed. In
Fri's Technical Blog we also noted the market's engagement of the
2.8076-to-2.8159-area marked by the 61.8% retrace of Jun0-Sewp's 3.2758 -2.1877
decline and the 1.000 progression of Sep-Oct's initial 2.1877 - 2.6185
(suspected a-Wave) rally from 18-Oct's 2.3526 (suspected b-Wave) low. We
remind longer-term players that because of the unique and compelling confluence
of:
early-Aug's bearish divergence in WEEKLY momentum
amidst
historically
extreme bullish sentiment/contrary opinion levels in our RJO Bullish
Sentiment Index
an
arguably complete and massive 5-wave Elliott sequence from Mar'20's 0.4605
low to Jun's 4.3260 high (as labeled in the weekly log active-continuation
chart below) and
the
5-wave impulsive sub-division of Jun-Sep's (suspected initial 1st-Wave) decline
The
recovery attempt from 26-Sep's 2.1877 low is arguably only a 3-wave (Wave-2)
corrective rebuttal to Jun-Sep's decline within a massive, multi-quarter
PEAK/reversal process. Now granted, due to the magnitude of 2020 -2022's
secular bull market, we discussed the prospect for this (2nd-Wave corrective)
recovery to be "extensive" in terms of both price and time. A
"more extensive" correction is typified by a retracement of 61.8% or
more and spanning weeks or even months following a 3-month decline. Per
such, the (suspected corrective) recovery from 26-Sep's 2.1877 low could easily
have further to go, with commensurately larger-degree weakness than that
exhibited this week (i.e., a failure below at least 2.4822) required
to consider the correction complete. Indeed, the daily log chart above
shows the market thus far respecting former 2.6185-area resistance from 10-Oct
as a new support candidate.
These
issues considered, very shorter-term traders have been advised to move to a neutral/sideline
position following overnight's momentum failure below 2.6328, with a recovery
above 2.8172 required to negate this call, reaffirm the recovery and re-expose
potentially significant gains thereafter. For intermediate- and
longer-term players, a bullish policy and exposure remain advised with a
failure below 2.4822 required to threaten this call enough to warrant
neutralizing exposure. We will be watchful for another bearish divergence
in momentum following a recovery attempt that falls short of Fri's 2.8172 high
that would be considered the next reinforcing factor to a count calling that
2.8172 high the prospective end to the month-and-a-half 2nd-Wave
correction. In lieu of such, a resumption of the current rally to
eventual new highs above 2.8172 should not surprise.