Looking to diversify your investment portfolio with futures trading, but lack the expertise on your own? Trading Systems and their programs are now listed on our website complete with track records, products traded and minimum account requirements and fees. If you need help navigating the site and viewing the results, give us a call.
New: Micro Bitcoin Investor Kit
Bitcoin is on an unprecedented run and is at the forefront of the trend in cryptocurrency and as a response, the CME has released a micro Bitcoin futures contract that is 1/10th the size of a regular Bitcoin futures contract. Learn everything you need to trade the micro Bitcoin futures contract with this Investor Kit!
The Markets
Metals - Gold Trying to Find its Place
Gold Trying to Find its Place
By: RJOF Editorial TeamPosted 12/03/2021
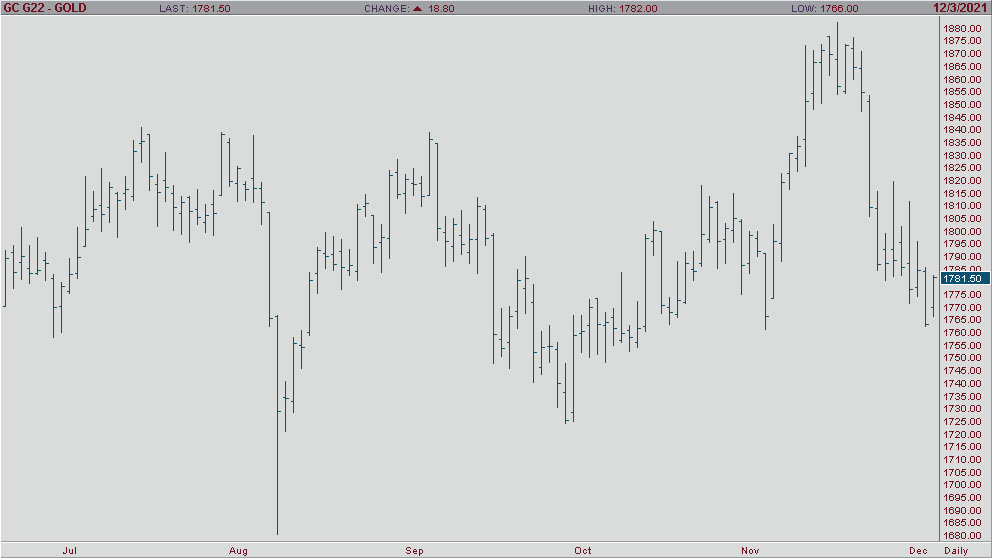
Gold prices are holding firm so far during Friday’s trading session as we learn more and more news regarding the latest Covid-19 variant, omicron. We are seeing the market taking a sort of “wait and see approach” as we have a number of conflicting momentum drivers impacting gold. On one had, we had a relatively strong jobs report this morning which is generally a sign of strength in the economy which leads investors to invest in equities and currency more so than gold. On the other hand, we have the uncertainty surrounding the omicron variant which is leading investors to wonder if they should invest in the relatively steady and safe gold, or follow the jobs data. All-in-all gold is still searching for a level of support below $1,800 and has been trying to find it all week. As it stands now, gold is pacing for a 1.2% decline on the week, its 3rd consecutive week of loss. If you have any questions please feel free to reach out to us.
Gold Feb '22 Daily ChartEnergy - Oil Higher as OPEC+ Continue Output Hike
Oil Higher as OPEC+ Continue Output Hike
By: Alex Turro, Senior Market StrategistPosted Dec 3, 2021 9:34AM CT
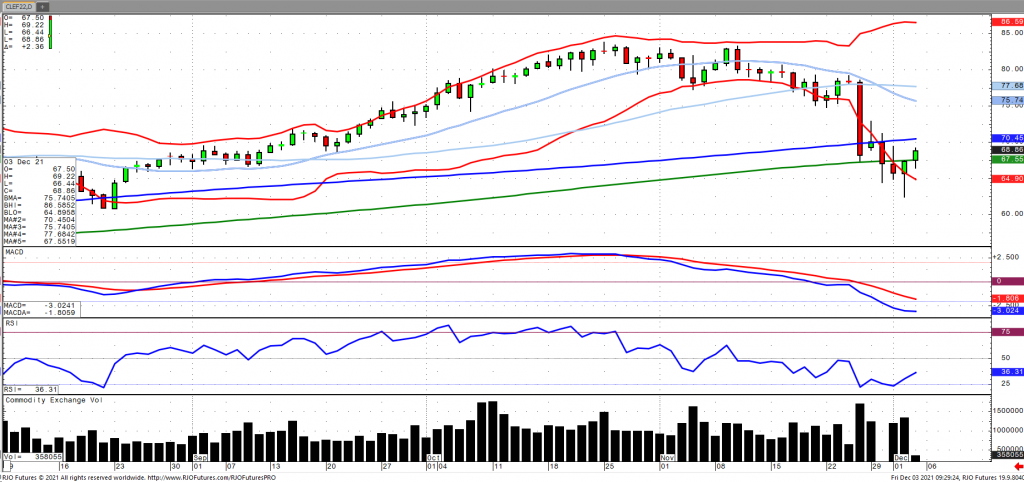
Oil prices appear to have found their footing as they clawed back early losses yesterday as OPEC+ have agreed to continue with their scheduled output hike of 400,00 barrels per day in January following record cuts last year. However, OPEC+ noted that they can make ‘immediate adjustments’ if need be as the market assess the impact of the COVID variant on demand, specifically fuel demand. Crude stocks fell -909k barrels last week with stocks now -54.931mb below last year and -29.321mb below the five-year average, according to the EIA. Oil volatility (OVX) has continued to remain elevated despite coming off its most recent high of 78 to 55-60 with the market transitioning to bearish trend with today’s range (due to the volatility) seen between 60.95 – 81.57.
Crude Oil Jan '22 Daily Chart If you have any questions or would like to discuss the markets further, please feel free to contact me at 800-438-4805 or aturro@rjofutures.com. Softs - Cocoa Futures and the Unknown Affect the Omicron Variant Will Have on the Markets
Cocoa Futures and the Unknown Affect the Omicron Variant Will Have on the Markets
By: Peter MoosesPosted 12/03/2021
As
we continue a volatile week of trading after the new global variant Omicron was
announced, traders wonder how long these trading conditions will last. The
moves in the equities the past week look very similar to days we saw in March
of 2020 – 500 points lower, 500 points higher give-or-take and repeat. So
traders are asking themselves, is this volatility here to stay or will we
experience a Santa Claus rally, Friday’s job’s data may provide some direction,
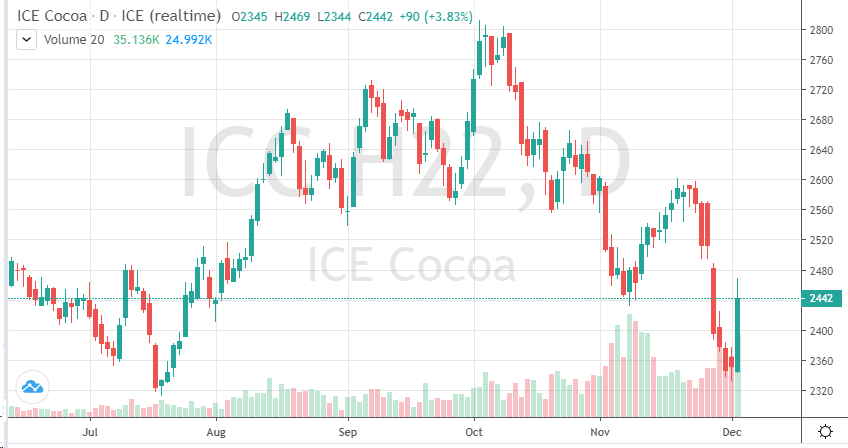
at least in the short-term. The cocoa market rallied Thursday, erasing recent
loses – following the move in the equities for now.
Demand
in cocoa will be a key fundamental to watch. If earnings and demand look
positive, cocoa should continue to climb back towards 2600. If this new Omicron
variant proves to be a new concern and new restrictions are implemented –
fundamentals won’t have control of the market, but outside global factors will
be in control.
Trader’s
need to also keep an eye on weather patterns in West Africa as the dry season
approaches. With the current expectations in the coming weeks, it looks like
prices should find support.
For now, traders should take a wait and see approach in the coming days as more news is likely to break on the variant, but solid answers won’t be available till year end according to health officials and vaccine companies.
On
the heels of mid-Sep-to-early-Oct's steeper, accelerated, 3rd-wave-looking
recovery, the past week-and-a-half's boringly lateral chop is first considered
a corrective/consolidative event that warns of a continuation of the uptrend
that preceded it to new highs above 04-Oct's 891.0 high. This count
remains consistent with our broader base/correction/recovery count introduced
in 13-Sep's Technical Blog following that
day's bullish divergence in short-term momentum above 07-Sep's 809.5 minor
corrective high detailed in the hourly chart below.
The
important takeaway from this month's lateral, sleepy price action is the
definition of Wed's 851.5 low as
the end or lower boundary of a suspected 4th-Wave correction. A failure
below 851.5 will confirm a bearish divergence in daily momentum and defer or
threaten a bullish count enough to warrant non-bullish decisions like
long-covers. A failure below 851.5 will not
necessarily negate a broader bullish count, but it will threaten it enough to
warrant defensive measures as the next pertinent technical levels below 851.5 are
13-Sep's prospective minor 1st-Wave high at 813.8 and obviously 08-Sep's 766.0
low. And making non-bullish decisions "down there" is
sub-optimal to say the least. Per such, both short- and longer-term
commercial traders are advised to pare or neutralize bullish exposure on a
failure below 851.5, acknowledging and accepting whipsaw risk- back above 04-Oct's
891.0 high- in exchange for much deeper and sub-optimal nominal risk below
766.0.
On
a broader scale, the daily log scale chart above shows the developing potential
for a bearish divergence in daily momentum that will be considered confirmed
below 851.5. This chart also shows the past month's recovery thus far
stalling in the immediate neighborhood of the (888.0) Fibonacci
minimum 38.2% retrace of Apr-Sep's entire 1128 - 766 decline). COMBINED
with a failure below 851.5, traders
would then need to be concerned with at least a larger-degree correction pf the
past month's rally and possibly a resumption of Apr-Sep's major downtrend.
Until
and unless the market fails below 851.5 however, we would
remind longer-term players of the key elements on which our bullish count is
predicated:
a confirmed bullish divergence in WEEKLY momentum
(below)
amidst
an
historically low 11% reading in out RJO Bullish Sentiment Index and
a
textbook complete and major 5-wave Elliott sequence down from 29-Apr's
1128 high to 08-Sep's 766.0 low.
Thus
far, the market is only a month into correcting a 4-MONTH, 32% drawdown, so
further and possibly protracted gains remain well within the bounds of a major
(suspected 2nd-Wave) correction of Apr-Sep's decline within an even more
massive PEAK/reversal process from 17-May's 1219 high on an active continuation
basis below.
These
issues considered, a bullish policy and exposure remain advised with a failure
below 851.5 required to defer or threaten this call enough to warrant moving to
a neutral/sideline position. In lieu of such weakness, we anticipate a
continuation of the past month's rally to new highs and potentially significant
gains above 891.0.
Agricultural - Grains - Minor Upside Breakout
Grains - Minor Upside Breakout
By: Michael Sabo, Senior Market StrategistPosted Dec 3, 2021 10:46AM CT
Last week I advised traders “The
market appears poised to continue higher, but not without some selling pressure
from time to time.” That’s exactly how this week started out with a small
sell off on Monday and Tuesday followed by a 3-day rally. At the time of this
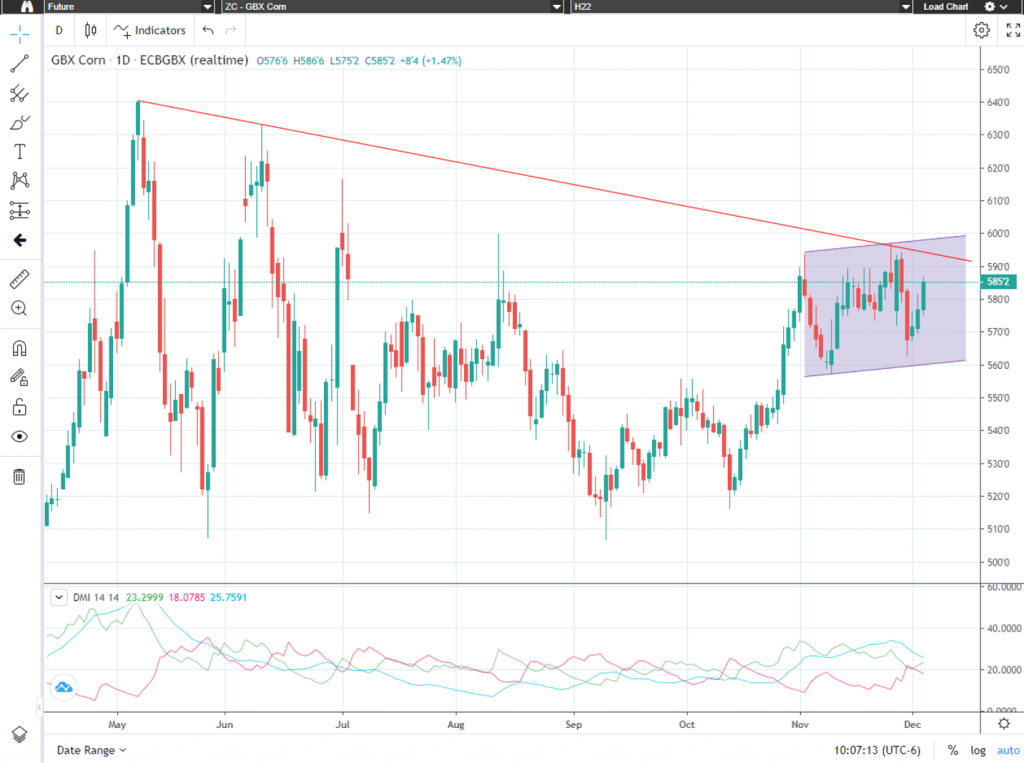
writing March corn is trading $5.83 with a high of $5.86 3/4. Today’s break
above $5.83 ¼ is a minor break out to the upside after 2 days of market
consolidation. Traders should watch for another push to break above the major
trendline (see red line on chart below) if that happens, I believe it will, the
market should push quickly to the $6.00 area. I remain bullish and look for the
market to continue to trade inside the bull channel (see shaded area on chart
below).
The “big picture” numbers remain the
same and probably will for some time. I firmly believe a break below $4.96 could
give the bears control of the market and a break above $6.39 ½ on the upside may
have enough bulls behind it to propel corn to all-time highs. There are several
minor areas of support and resistance inside this range that can help with
short term market direction if violated. Call me directly at 1-800-367-7290 for
more in-depth discussion on these numbers and to discuss trading strategies
specific to your situation.
I would suggest using an option
strategy to manage your futures position risk or an outright option strategy. Implied
option volatility has come down quite a bit from its most recent highs mainly
due to the consolidation and tighter trading ranges. I have 25 years of grain
market experience, feel free to call or email with any questions you may have. Be
sure to check out my archived weekly grain market insight articles posted on
our website.
**** Reserve
your FREE 2022 Commodity Trading Guide Today! ****
This 55-page guide is packed with indispensable market information. It has a complete commodity calendar that lists the dates and times of Market Reports, option expiration dates, futures first notice dates, futures last trade dates, etc. It readily serves as your commodity market encyclopedia giving you an in depth look at each commodity, there is market almanac for all actively traded commodities and much more! To reserve your complimentary Commodity Trading Guide, send me an email at msabo@rjofutures.com with the following information: your full name, mailing address and a preferred phone number so we can confirm your request. Once confirmed, I will reserve your trading guide, and have it sent out as soon as we receive them.
Corn Mar '22 Daily Chart If you have any questions or would like to discuss the markets further, please feel free to contact me at 800-367-7290 or msabo@rjofutures.com. Equity - S&P Weakens Further, Reinforces Broader Peak/Correction/Reversal Threat
In yesterday morning's Technical Update we discussed varying and increasing levels or degrees of weakness that reinforce broader peak/correction/reversal-threat environments. The 240-min chart below shows yesterday afternoon's sharp relapse below Tue's 4557 low that clearly reaffirms the developing downtrend with the important by-product of this continued weakness being the market's definition of yesterday's 4651 high as the latest smaller-degree corrective high this market is now minimally require to recoup to arrest the clear and present downtrend and reject/define a more reliable low and support from which to recalibrate the correction-vs-reversal debate and challenge down from 22-Nov's increasingly important 4741 high. In lieu of a recovery above at least 4651, at least the intermediate-term trend remains down ahead of further and possibly accelerated losses straight away. And per such, our new mini and short-term bear risk parameters from which traders can objectively rebase and manage the risk of non-bullish decisions like long-covers and cautious bearish punts are 4651 and 4741.
From
a long-term perspective, the magnitude of the secular bull market is clear in
the weekly log chart below, where commensurately larger-degree weakness below
01-Oct's 4260 larger-degree corrective low and key long-term
risk parameter remains required to break the secular bull and expose a major
reversal lower. Again, as recently discussed, we cannot conclude a major
reversal from proof of only shorter-term weakness. And thus far, the past
couple weeks' relapse remains well within the bounds of relatively
shorter-term, bull-market-corrective weakness.
This
said however, all long-term momentum failures begin with smaller-degree bearish
divergence in momentum exactly like that that we have experienced the past two
weeks. And what the market has in store for us between spot and 01-Oct's
pivotal 4260 low is anyone's guess. What is not a guess
is what the market now has to do defer or mitigate a broader bearish
count. Specifically and objectively, this market needs to recover above
yesterday's 4651 corrective high and mini bear risk
parameter. Until and unless such strength is shown, the market's
immediate downside potential is indeterminable and potentially severe straight
away.
Contributing
to this downside threat and vulnerability are:
clearly waning upside momentum on a long-term weekly basis below
historically frothy levels in the Bullish Consensus (marketvane.net) measure of market sentiment/contrary unseen in nearly FOUR YEARS
an "outside WEEK" last week (higher high, lower low and lower close than the previous week's range and close), and
the prospect that Oct-Nov's portion of the bull was the completing 5th-wave to a massive 5-wave Elliott sequence from Mar'20's 2174 low as labeled.
Additionally
and updated only yesterday by the American Association of Individual Investors
(AAII), Americans' portfolio positions allocated to equities moved to 71.4%,
its highest level since Jan'18 and an ensuing and volatile period that saw the
market languish/chop for the entire year before an ultimate decline of
21%. Alone, such an indicator is relatively useless as it can stay
"high" indefinitely as long as the simple uptrend pattern of higher
highs and higher lows sustains itself. BUT COMBINED WITH a bearish
divergence in momentum that defines a more reliable high, resistance and a bear
risk parameter, such emotional frothiness has to be considered a source of fuel
for downside vulnerability until nullified by a resumption of the major
uptrend.
Again,
the size or "scale" of the past couple weeks' decline is thus far too
small to CONCLUDE a major reversal. But the ancillary evidence listed
above is clearly typical of peak/reversal environments that ultimately prove
major in scope. And as a result of yesterday's resumed weakness, if
non-bullish action like long-covers or pared bullish exposure to more
conservative levels hasn't been taken, longer-term traders and investors are
relegating themselves to the only other objective bull risk parameter that remains
below the market: 4260.
These issues considered, a neutral/sideline policy remains advised for shorter-term traders while long-term players and investors are advised to pare bullish exposure to more conservative levels with commensurately larger-degree weakness below 4260 the only remaining level below the market from which bull risk can still be objectively based. In lieu of a sell-off-stemming bullish divergence in short-term momentum needed to reject/define a more reliable low and support, we see NO levels of any technical merit between spot and 4260, so the market's immediate downside potential is indeterminable and potentially severe. A recovery above 4651 is, at this juncture, minimally required to arrest the slide and provide new, objective flexion points from which to readdress the correction-vs-reversal debate. In lieu of such strength, further and possibly accelerated losses are anticipated.
Economy - S-T Mo Failure Insufficient to End RBOB Correction, But Beware
S-T Mo Failure Insufficient to End RBOB Correction, But Beware
By: RJO Market InsightsPosted 11/08/2022
Posted on Nov 08, 2022, 07:51 by Dave Toth
In Fri's Technical Webcast we identified a
minor corrective low at 2.6328 from Thur as a mini risk parameter the market
needed to sustain gains above to maintain a more immediate bullish count.
The 240-min chart below shows the market's failure overnight below this level,
confirming a bearish divergence in very short-term momentum. This mo
failure defines Fri's 2.8172 high as
one of developing importance and a parameter from which very short-term traders
can objectively base non-bullish decisions like long-covers.
Given
the magnitude of the past three weeks' broader recovery however, this
short-term momentum failure is of an insufficient scale to conclude anything
more than another correction within this broader recovery from 26-Sep's 2.1877
low. Indeed, overnights failure below 2.6328 only allows us to conclude
the end of the portion of the month-and-a-half rally from 31-Oct's 2.4822 next
larger-degree corrective low. 2.4822 is the
risk parameter this market still needs to fail below to break the uptrend from
18-Oct's 2.3526 low while this 2.3526 low
remains intact as the risk parameter this market needs to fail below to break
the month-and-a-half uptrend. From an
intermediate-to-longer-term perspective, this week's setback falls well within
the bounds of another correction ahead of further gains. This is another
excellent example of the importance of technical and trading SCALE and
understanding and matching directional risk exposure to one's personal risk
profile.
The
reason overnight's admittedly minor mo failure might have longer-term
importance is the 2.8172-area from which it stemmed. In
Fri's Technical Blog we also noted the market's engagement of the
2.8076-to-2.8159-area marked by the 61.8% retrace of Jun0-Sewp's 3.2758 -2.1877
decline and the 1.000 progression of Sep-Oct's initial 2.1877 - 2.6185
(suspected a-Wave) rally from 18-Oct's 2.3526 (suspected b-Wave) low. We
remind longer-term players that because of the unique and compelling confluence
of:
early-Aug's bearish divergence in WEEKLY momentum
amidst
historically
extreme bullish sentiment/contrary opinion levels in our RJO Bullish
Sentiment Index
an
arguably complete and massive 5-wave Elliott sequence from Mar'20's 0.4605
low to Jun's 4.3260 high (as labeled in the weekly log active-continuation
chart below) and
the
5-wave impulsive sub-division of Jun-Sep's (suspected initial 1st-Wave) decline
The
recovery attempt from 26-Sep's 2.1877 low is arguably only a 3-wave (Wave-2)
corrective rebuttal to Jun-Sep's decline within a massive, multi-quarter
PEAK/reversal process. Now granted, due to the magnitude of 2020 -2022's
secular bull market, we discussed the prospect for this (2nd-Wave corrective)
recovery to be "extensive" in terms of both price and time. A
"more extensive" correction is typified by a retracement of 61.8% or
more and spanning weeks or even months following a 3-month decline. Per
such, the (suspected corrective) recovery from 26-Sep's 2.1877 low could easily
have further to go, with commensurately larger-degree weakness than that
exhibited this week (i.e., a failure below at least 2.4822) required
to consider the correction complete. Indeed, the daily log chart above
shows the market thus far respecting former 2.6185-area resistance from 10-Oct
as a new support candidate.
These
issues considered, very shorter-term traders have been advised to move to a neutral/sideline
position following overnight's momentum failure below 2.6328, with a recovery
above 2.8172 required to negate this call, reaffirm the recovery and re-expose
potentially significant gains thereafter. For intermediate- and
longer-term players, a bullish policy and exposure remain advised with a
failure below 2.4822 required to threaten this call enough to warrant
neutralizing exposure. We will be watchful for another bearish divergence
in momentum following a recovery attempt that falls short of Fri's 2.8172 high
that would be considered the next reinforcing factor to a count calling that
2.8172 high the prospective end to the month-and-a-half 2nd-Wave
correction. In lieu of such, a resumption of the current rally to
eventual new highs above 2.8172 should not surprise.
Economy - Futures Market Outlook w/John Caruso - 12/03/2021
Futures Market Outlook w/John Caruso - 12/03/2021
By: John Caruso, Senior Market StrategistPosted Dec 3, 2021 10:28AM CT
Markets reversed hard yesterday…following morning strength the reversal hit roughly around 11am CST and then approximately 30 min later we had news of our first Omicron case in the USA. Not to mention, Powell doubling down on a faster pace of the taper yesterday. So, for the 3rd day out of 4 (since the selling began last Friday) everything that could go wrong with stocks, did. Uncertainty remains in high supply at the moment, and it’s natural that your first reaction is to retreat, when in fact I believe you should be leaning into this – at least this is what recent history has told us to do not to mention our indicators. So right now, I believe the market is in the “digestion” phase of the news – we haven’t been hit with a news cycle such as this since the September sell-off on Evergrande and Delta variant. Going to cash on that news cycle back in Sept and VIX > 28 proved to be a terrible decision, and with our Q4 GDP projections north of 7% we don’t see any cycle risk. Yes, Powell hit us over the head with a 2X4 – while we expected a hawkish pivot by the Fed, we didn’t expect it until at minimum the January meeting.
While we’re in the midst of cycle phase transition, as
inflation slows off of 30 year highs – the growth cycle remains strong.
IVOL premiums remain extremely bloated with the SP500 at +92%, NQ +70%, and RTY
+69%
NFP Payroll Data is due out tomorrow
I’ll have our TRM table and numbers out shortly. We are at the low end of plenty of ranges/with trends still intact. Back soon.
If you have any questions or would like to discuss the markets further, please feel free to contact me at 800-669-5354 or jcaruso@rjofutures.com.