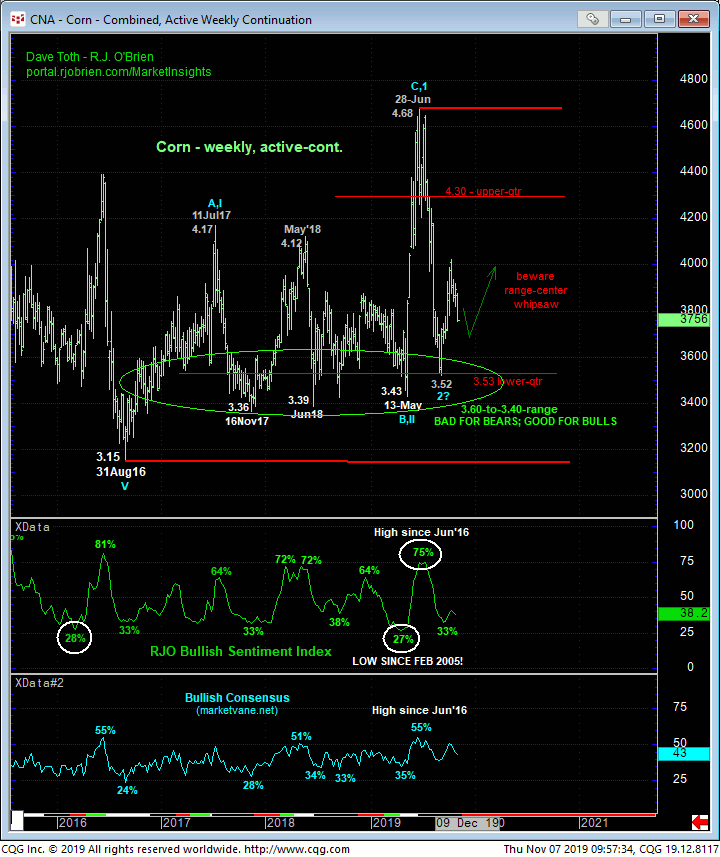
With the market traipsing around either the lower-quarter of the four year lateral range or its upper-quarter, it’s a lot easier to have a directional bias- up or down, respectively- with favorable risk/reward merits like those discussed in 10-Sep’s Trading Strategies Blog just before 12-Sep’s key crop reports and in 10-Jul’s Trading Strategies Blog just before 11-Jul’s key crop reports. With the market floating within the middle-half bowels of this massive range shown in the weekly chart below where we always approach the odds of aimless whipsaw risk as higher, traders and hedgers have to acknowledge, be flexible to and prepare for a directional move either way. Per such, we will introduce both bear and bull hedges with very favorable risk/reward merits below that both producers and end-users can safely engage tomorrow’s key crop reports. But we want to start with an overview of the technical construct from which these specific strategies are structured.
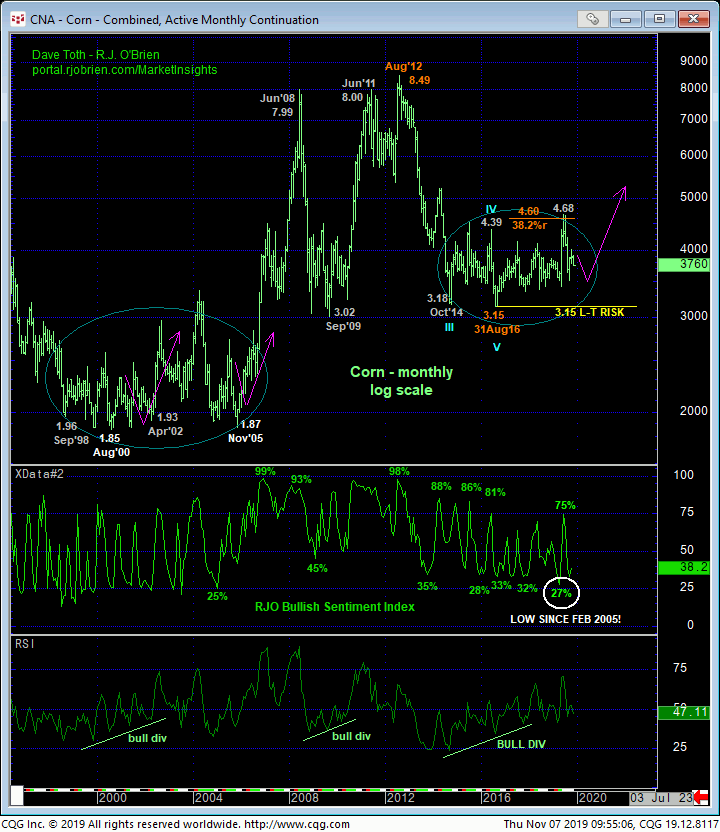
Reiterating many of our past few years’ Technical Blogs, we still believe that a major, multi-year base/reversal environment has been intact that dates from Oct’14’s 3.18 low and includes Aug’16’s 3.15 low and the market’s gross failure to sustain the secular bear trend. Combined with historically bearish sentiment not only during that 3Q16 period, but on EVERY attempt since then to breach the range’s lower-quarter, the past five years’ price action is a mirror image to that that followed Sep 1998’s 1.96 low and eventually- EIGHT years later- led to the secular bull explosion to 2012’s 8.49 all-time high.
During that entire 8-year period, this market experienced explosive, if short-lived rallies just like we experienced this past May-Jun and deep, corrective retests of the range’s lower boundary. But the market never broke Aug 2000’s defined 1.85 low and key long-term bull risk parameter. This is exactly how we’re categorizing 31Aug16’s 3.15 low. Until it’s broken, relapses back to the lower-quarter of the 3.15-to-4.68-range (3.53 and below) are advised to be approached as outstanding risk/reward buying opportunities for long-term players.
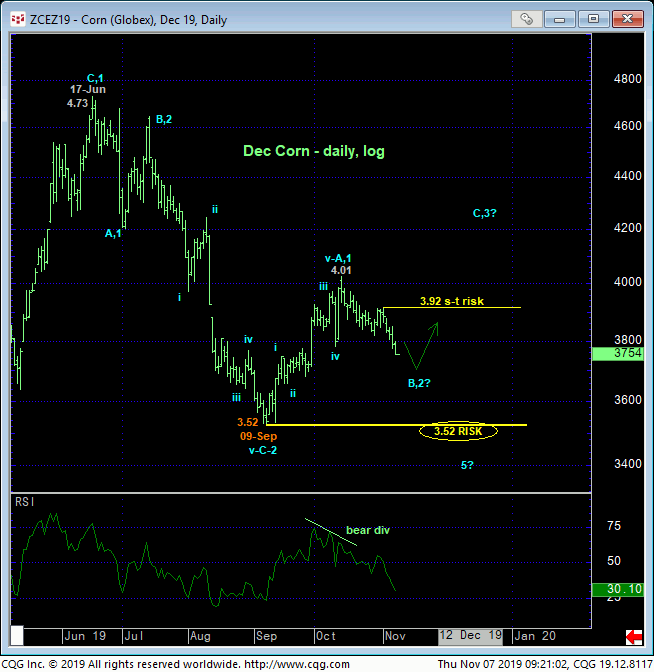
From an intermediate-term perspective however, where the next 20-cent move is coming is a coin flip currently because the shorter-term trend is down and the longer-term trend remains arguably up until and unless the market breaks 09-Sep’s 3.52 low and key risk parameter. This is why we’ll discuss hedge strategies for both end-users and producers.
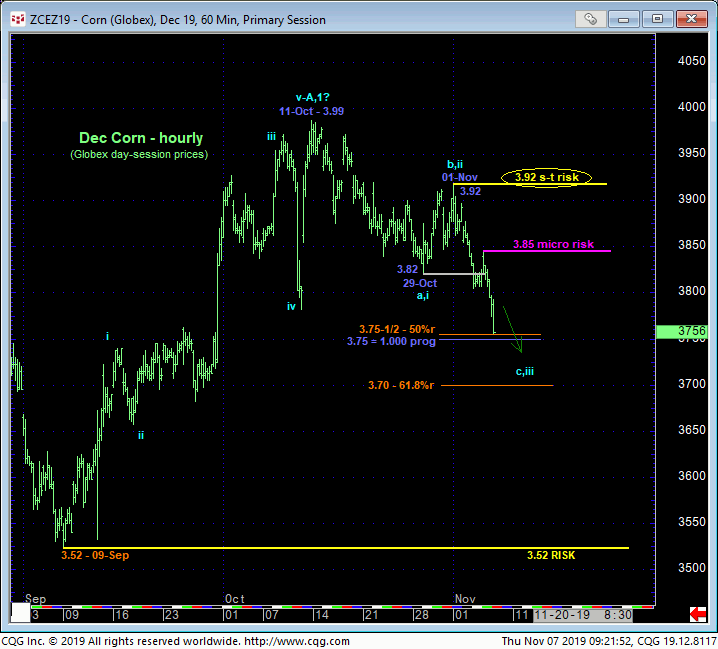
From a short-to-intermediate-term perspective, we introduced the prospect for a corrective setback in 23-Oct’s Technical Blog following 22-Oct’s bearish divergence in very short-term momentum that recognized 11-Oct’s 3.99 Globex day-session high as one of developing importance. Subsequent losses, including an interim bullish divergence in mo, whipsaw and resumed slide are detailed in the hourly chart below. Today’s further slide leaves yesterday’s 3.85 high and 01-Nov’s 3.92 high as the latest smaller-degree corrective highs that now serve as our new micro- and short-term risk parameters from which shorter-term traders and producers can objectively rebase and manage the risk of bearish decisions.
If the market has something broader to the bear side in store, it would be expected to sustain trendy, impulsive behavior below these 3.85 and 3.92 risk parameters. Its failure to do so will first threaten and then negate a bearish count, warranting the cover of any bearish exposure or hedge. Until such strength is proven, we act on the premise that we don’t know how low “low s for the clear and present intermediate-term downtrend. These 3.85 and 3.92 risk parameter are equally important to end-users as the market’s recovery above them would raise the sense of urgency once again on this market’s broader bullish intentions, warranting upside protection.
Notably, the hourly chart below shows the market’s slide currently reaching a pair of Fibonacci relationships around 3.75. 3.75-1/2 is the 50% retrace of Sep-Oct’s 3.52 – 3.90 rally while 3.75 is the 1.000 progression of late-Oct’s initial 3.90 – 3.82 decline from 01-Nov’s 3.92 corrective high. IF the past few weeks’ setback is just a correction of Sep-Oct’s rally, we would expect the market to arrest this slide with a bullish divergence in momentum from an area like 3.75 or perhaps the (3.70) 61.8% retrace. The operative technical tool here however s MOMENTUM, not the interesting but merely derived Fib levels that, by themselves, are unreliable and useless.
Moving out to a daily basis however, the extent and (5-wave) impulsiveness of Sep-Oct’s rally, let alone all the long-term bullish stuff discussed above like historically bearish sentiment and the market’s repetitive rejection of the lower-quarter of the 4-year range, remain as key components to a broader base/reversal-threat environment. A failure below 09-Sep’s 3.52 obviously key low and risk parameter remains required to negate this specific bullish count and expose another run on the 3.40-to-3.36-range that has repelled each and every assault over the past TWO YEARS. Despite what, on each occasion, were grossly bearish fundamental factors, this market has failed miserably to sustain the downtrend each time it attempted to make any headway below that 3.43 / 3.36-area.
In effect we believe this market has identified 3.52 and 3.92 as the key directional triggers heading forward. Shorter-term traders and producers are advised to maintain a cautious bearish policy with a recovery above at least 3.85 and preferably 3.92 required to negate this call and warrant its cover. longer-term players and end-users however are advised to maintain a cautious bullish policy with a failure below 3.52 required to negate this call and warrant its cover. Please see specific bull and bear hedge strategies below that are structured with these directional triggers and suspected support and resistance in mind.
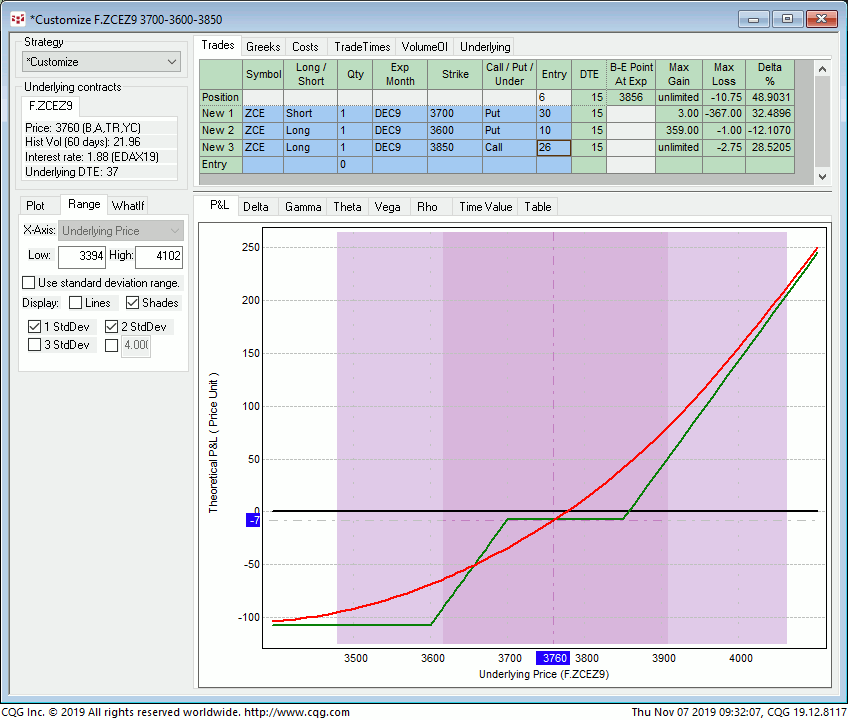
BULL HEDGE STRATEGY: SHORT DEC 3.70 – 3.60 PUT SPREAD / LONG DEC 3.85 CALL COMBO
This strategy involves selling the Dec 3.70 – 3.60 put spread for around 2-cents and buying the Dec 3.85 calls for around 2-3/6-cents for a net debit of about 3/4-cent. This strategy provides:
- a current net delta of +0.49
- favorable margins
- risk/cost of the 3/4-cent premium if the underlying Dec contract expires anywhere between 3.70 and 3.85 at expiration in 15 days on 22-Nov
- maximum risk of 10-3/4-cents on ANY decline below 3.60 and
- unlimited, dollar-for-dollar upside hedge protection above its 3.86 breakeven at expiration.
Granted, this strategy, like the one below, may only be applicable for the next two weeks. But if tomorrow’s key crop report turns out to be, in fact, “key”, prompting a big move either way, this strategy will do its job. And if the market explodes higher, the 3.85 calls will exercise into aggressive long future exposure. If tomorrow’s report is a dud, we’ve got the risk parameters and directional triggers specified above around which to base directional decisions.
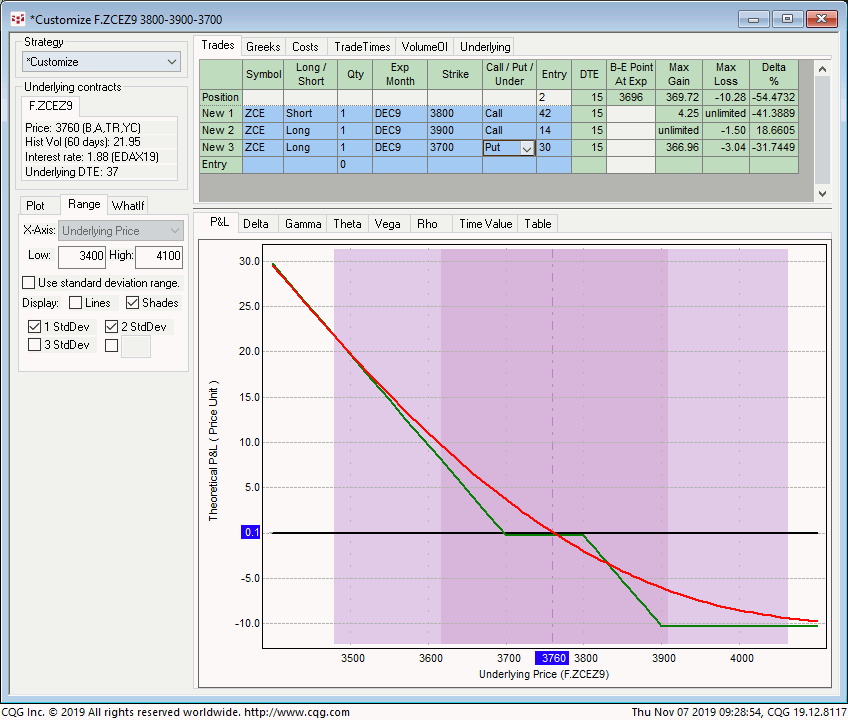
BEAR HEDGE STRATEGY: SHORT DEC 3.80 – 3.90 CALL SPREAD / LONG DEC 3.70 PUT COMBO
This strategy is the inverse of the above strategy that involves selling the Dec 3.80 – 3.90 call spread for around 2-3/4-cents and buying the Dec 3.70 puts around 3-cents for a net cost of a 1/4-cent. This strategy provides:
- a current net delta of -0.54
- favorable margins
- risk/cost of the 1/4-cent premium if the underlying Dec contract expires anywhere between 3.70 and 3.80 at expiration in 15 days on 22-Nov
- maximum risk of 10-1/4-cents on ANY rally above 3.90, allowing the producer’s cash position to continue to profit, and
- virtually unlimited, dollar-for-dollar downside protection below its 3.69 breakeven at expiration.
Technically, we’ve identified the approximate 3.52-to-3.36-area as impenetrable support. But ya never know. And if the current intermediate-term trend continues or accelerates and breaks 09-Sep’s pivotal 3.52 low, we would be the last ones to try to strap some downside limit on such a move. Herein lies the importance of this bear hedge for producers. Limited and very manageable risk if the underlying contract reverses higher is also a key benefit of this strategy. Please contact your RJO representative for updated bid/offer quotes on these strategies.
