Lateral, challenging, frustrating trading-range environments are common in all markets and, in fact, occur a preponderance of the time. Once a trend ends and the market moves to such a non-trending state, we know that this means one of only two things: consolidation (within the broader trend) or reversal.
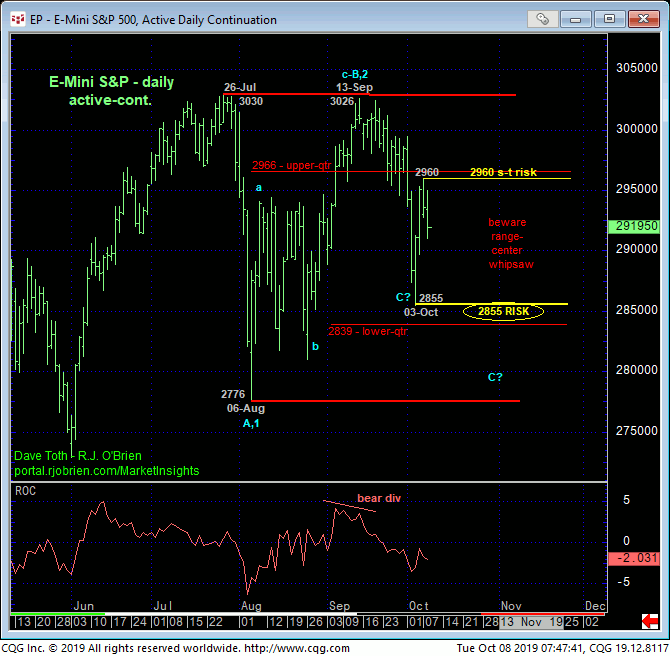
Only a glance at the daily chart below is needed to see that since 31-Jul’s bearish divergence in momentum discussed in 01-Aug’s Technical Blog, the market has been confined to a range bounded by 26-Jul’s 3030 all-time high and 06-Aug’s 2776 low. The reversion to the middle-half of this range following 24-Sep’s bearish divergence in momentum reaffirms this range by rejecting/defining 13-Sep’s 3026 high.
While the market could continue to consolidate between 3030 and 2776 and remain well within the bounds of a mere correction within the secular bull trend, we are trailing our recommended long-term bull risk to 03-Oct’s 2855 low, the failure below which would expose further weakness to, we believe, at least the lower-quarter of this range. But once “down there”, we don’t want to have to RELY on a requisite bullish divergence in momentum to arrest such a break and tilt the intra-range directional scales higher. So in the conservative interests of “being out, wishing we were in, than in, wishing we were out”, long-term players are advised to neutralize bullish exposure on a failure below 2855. This will circumvent the risk of a correction or reversal lower of indeterminable depth at that point.

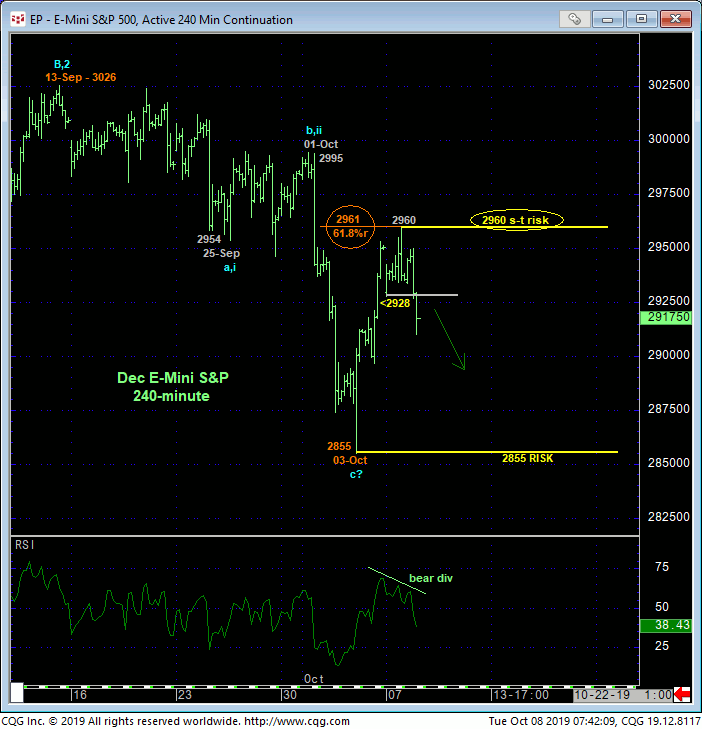
Part of our concern over what might lie beneath last week’s 2855 low stems from overnight’s bearish divergence in very short-term momentum detailed in the 24-min chart below. This mo failure stems from the exact (2961) 61.8% retrace of Sep-Oct’s 3026 – 2855 decline as well as an area of former support from the 2955-area from late-Sep that, since broken in early-Oct, is considered a new resistance candidate. As a result of this bearish divergence in admittedly short-term momentum, the market has identified yesterday’s 2960 high as one of developing importance and our new short-term risk parameter from which non-bullish decisions like long-covers and cautious bearish punts can now be objectively based and managed. Near-term strength above 2960 will allay fears of a more immediate bearish count that’s part of a larger-degree correction or reversal lower.

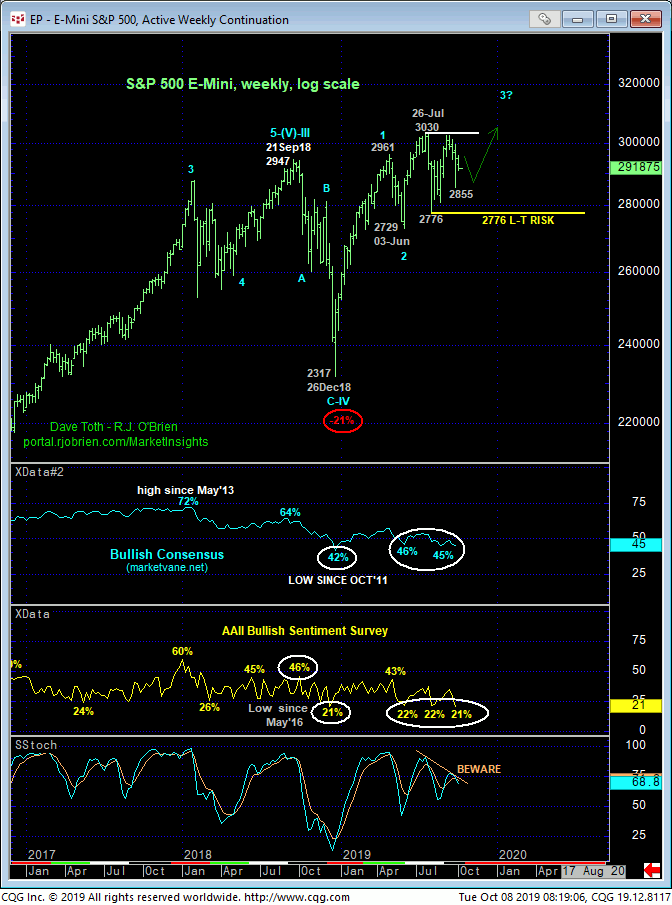
From a very long-term perspective shown in the weekly log chart below, two technical facts stand out:
- waning upside momentum that could result in protracted losses if/when confirmed with a break below 06-Aug’s 2776 initial counter-trend low
- historically BEARISH market sentiment that’s more typical of the ENDS of major corrections rather than the start of them.
The fact that so many are so bearish so early in a prospective bearish move suggests to us that the non-uptrending behavior that began with 31-Jul’s bearish divergence in mo is “just” part of a larger-degree correction/consolidation ahead of the eventual resumption of the secular bull rather than a major peak/reversal. That said, we cannot RELY on this call if/when the market breaks last week’s 2855 low. If, conversely, the market recoups yesterday’s 2960 high, this strength would reinforce a bullish count that would suggest “larger-degree” correction may unfold laterally rather than downwardly with the historic pessimism ultimately fueling upside vulnerability.
These issues considered, acknowledgement of and flexibility to a directional outcome EITHER WAY is urged with 2960 and 2855 considered the key directional triggers heading forward. A cautious bearish policy is advised for shorter-term traders with tighter risk profiles from the 2920 level OB with a recovery above 2960 negating this call and warranting its cover. Longer-term players remain OK to maintain a cautious bullish policy with a failure below 2855 required to negate this call and warrant its cover.


