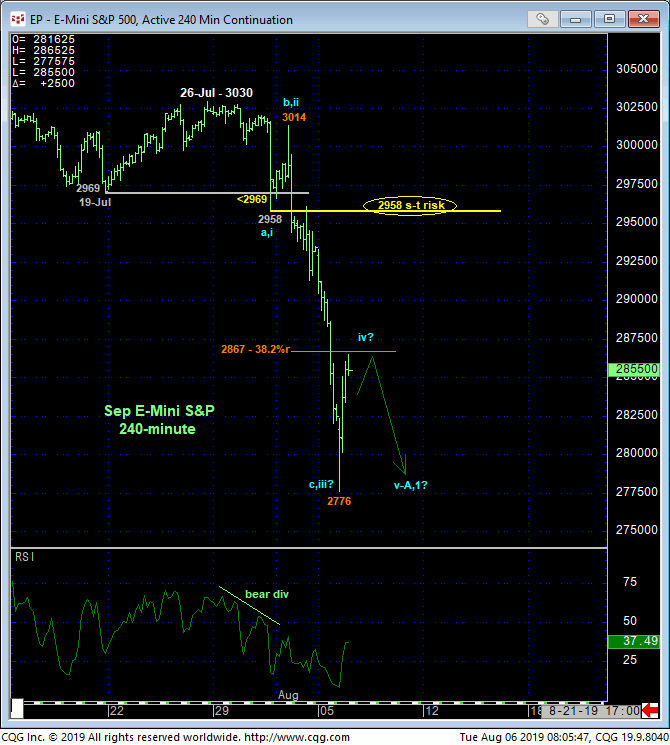
While the extent of overnight’s rebound is encouraging and identifies overnight’s spasm low at 2776 as one of developing importance, the fact that the market has not recovered above a prior corrective high or an initial counter-trend high maintains the prospect that this recovery is merely a corrective (4th-Wave) hiccup ahead of still further losses as sketched out in the 240-min chart below. The extent and uninterrupted nature of yesterday’s meltdown left no levels of any technical merit in its wake shy of last Wed’s 2958 initial (1st-Wave) counter-trend low and area of former support-turned-resistance. The Fibonacci fact that overnight’s rebound has thus far “only” retraced a minimum 38.2% of the prospective 3rd-Wave down from 3014 to 2776 would seem to reinforce the prospect that overnight’s recovery attempt is just a (4th-Wave) correction ahead of at least one more round of selling to new lows below 2776. The unfortunate consequence of this count is less about another round of new lows and more about identifying the shorter-term RISK parameter to our bearish count following 31-Jul’s momentum failure below 2969 discussed in 01-Aug’s technical Blog and bearish exposure recommended at 3002 OB. If/when the market resumes the slide below 2776, we can then quite objectively trail that shorter-term bear risk parameter to the end/top of this current recovery attempt. In the meantime, we are defining 2958 as our new short-term risk parameter to an interim bearish policy by shorter-term traders with tighter risk profiles.


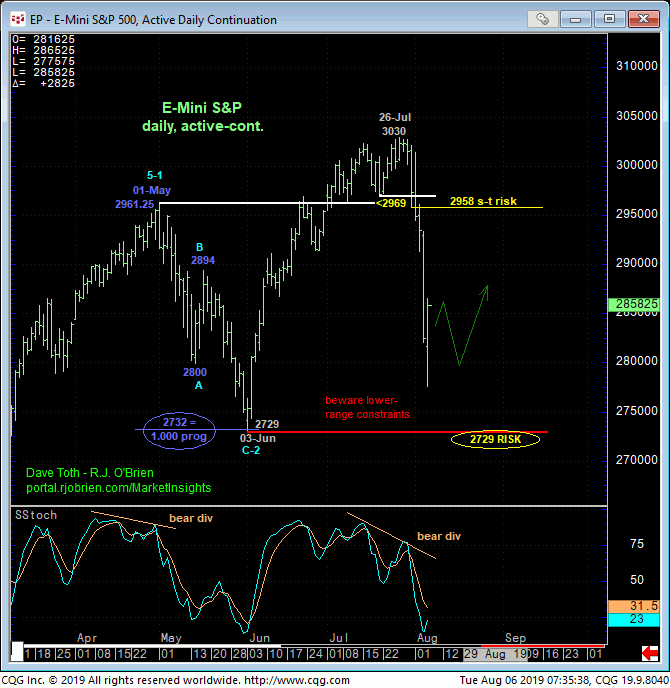
From a longer-term perspective and despite the extent of this week’s plunge and the hyperbole that comes with it, the market has not weakened enough to confirmed a broader peak/reversal-threat environment. Indeed and as discussed at length since early-Jun, 03-Jun’s 2729 larger-degree corrective low remains intact as our key long-term risk parameter this market is MINIMALY required to fail below to break even the uptrend from Dec’198’s 2317 low, let alone the secular bull trend. Until and unless such sub-2729 weakness is proven, long-term players are advised to first approach this sell-off attempt as a corrective buying opportunity.
But let’s play the devil’s advocate and conclude, prematurely, that this current headline-generating plunge IS the start of a more protracted move south that would warrant even paring or neutralizing long-term bull risk in personal IRAs and such. As we discussed is last Oct’s equally excitable plunge, the market typically does not make it easy for bears by sustaining such “obvious” weakness and vulnerability too early in a peak/reversal process. Rather, following such an “initial” countertrend plunge that has many heading for the exits, the market will typically produce an often-times extensive corrective rebuttal before the REAL bad bear stuff hits.
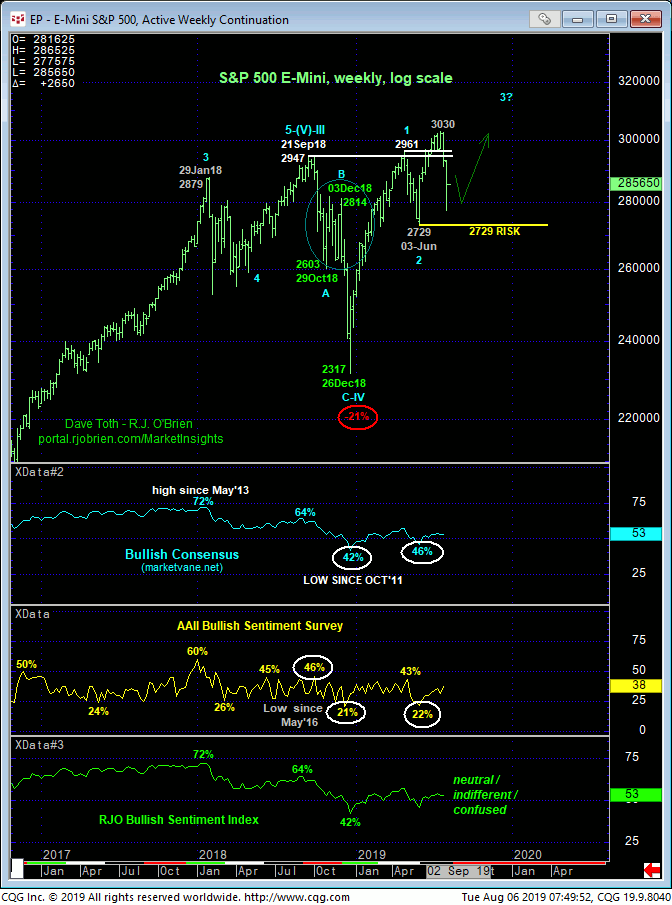
In last year’s example, we saw this by an extensive 61.8% retracement of the Sep-Oct’s initial 2947- 2603 plunge to 03Dec18’s 2814 high before the bottom fell out. Traders who “chased” initial counter-trend weakness had this extensive 6-week, 61.8% recovery to mess with their heads and trading accounts. IF IF IF the past week’s plunge is just the initial start of such a broader peak/reversal process, we strongly suspect that before the market melts down below 03-Jun’s 2729 low, it will provide a potentially extensive corrective rebuttal to the 2900-to-2930-area (or higher) before doing so. Such a rebound and secondary rollover will provide the outstanding opportunity to pare or neutralize even long-term bullish portfolios.

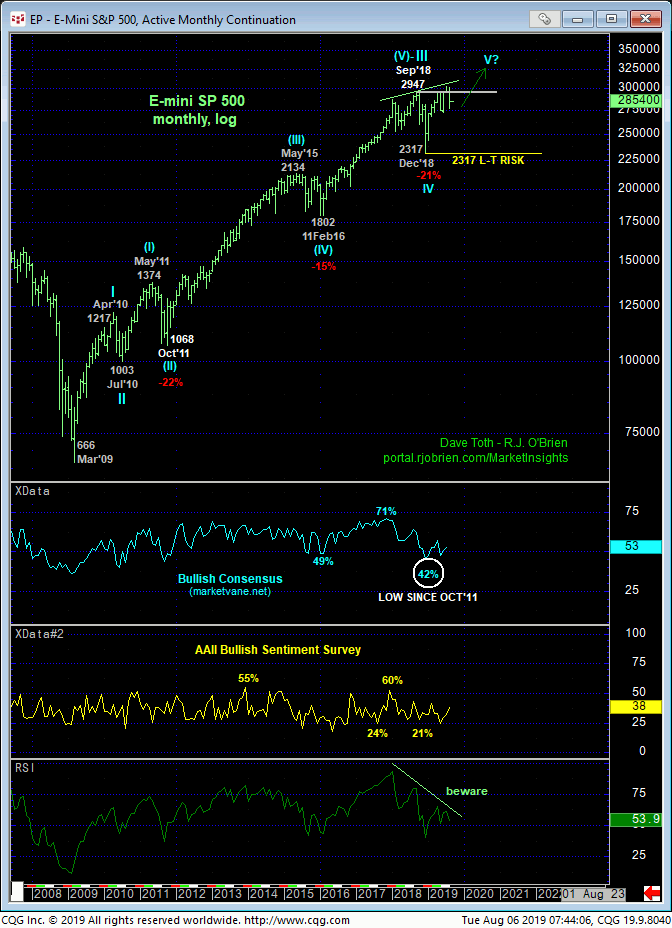
From an even longer-term monthly perspective shown below, upside momentum has arguably been waning since Jan 2018, suggesting a momentum failure that would be nothing short of massive in scope; unequivocal trade-of-the-century-type stuff. But first of all, to even COMNFIRM this momentum failure on this scale, the market would have to fail below Dec’18’s 2317 corrective low in order to, in fact, break the secular bull trend.
Additionally, market sentiment/contrary opinion levels would likely need to be stratospherically frothy to leave the market vulnerable to such a plunge. Before 2008-09’s bear market, Bullish Consensus (marketvane.net) and RJO Bullish Sentiment Index levels resided comfortably at or above 70% for months on end. Currently, these same contrary opinion indicators have been and continue to waft around neutral/indifferent/confused levels that hardly describe a frothy bullish condition typical of major peak/reversal conditions.
Per these two longer-term factors and given that the market has yet to provide enough evidence to suggest otherwise, longer-term players are advised to first approach this sell-off as a corrective buying opportunity with a failure below 2729 required to negate this count and warrant moving to a neutral/sideline position. Shorter-term traders with tighter risk profiles and bearish exposure recommended from 3002 OB are advised to take profits on this exposure and move to a neutral/sideline position as we believe the risk/reward merits of extending bearish decisions ‘down here” are poor. We will keep a keen eye for a bullish divergence in short-term momentum that would reject/define overnight’s 2776 low “enough” to consider it as our new short-term risk parameter from which non-bearish decisions like short-covers and cautious bullish punts can then be objectively based and managed.


