Fri’s recovery above Wed’s 3055 high nullifies the bearish divergence in micro momentum we discussed in Fri morning’s Technical Blog and reinstates the secular bull trend. The trend is up on all scales and, given new all-time highs, exposes a universe in which there are no resistance levels above it. The only levels that exist “up here” are those “derived” from past data points like Bollinger Bands, imokus, channel lines and even the vaunted Fibonacci relationships we cited often in our analysis. (We’d mock the derived and ever-useless moving averages up here too, but the market is above all of em.). And we know with absolute fact that every last one of these derived levels have never proven to be reliable reason to identify and rely on levels as resistance (or support) without an accompanying confirmed bearish (in this case) divergence in momentum. And they never will.
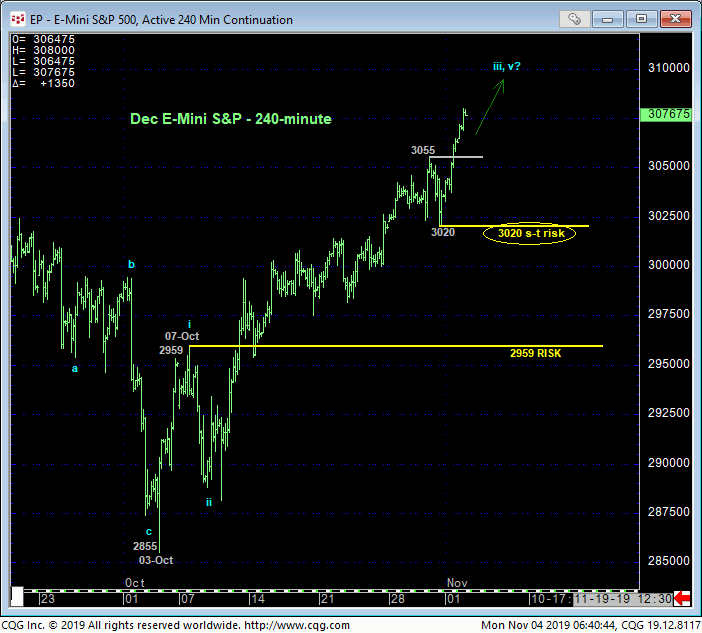
The only thing that matters in trying to discern and navigate a prospective peak in such a clear and present uptrend is MOMENTUM, and specifically, a confirmed bearish divergence. And this requires, quite simply, a failure below a prior corrective low or an initial counter-trend low. In the 240-min chart below and as a direct result of Fri/today’s resumed bull, the market has identified Thur’s 3020 low as the latest smaller-degree corrective low. This is the minimum level this market needs to fail below to even defer, let alone threaten the bull. This bull could peak out tomorrow. But until and unless the market fails below at least 3020, there’s no objective technical reason to believe this bull can’t tack on another 100, 200 or 300 points straight away. Per such, this 3020 level becomes our new short-term risk parameter from which a still-advised bullish policy and exposure can be objectively rebased and managed by shorter-term traders with tighter risk profiles.
From a longer-term perspective, 07-Oct’s 2959 (suspected 1st-Wave) high is now considered our new long-term risk parameter this market is required to fail below to jeopardize the impulsive integrity of the rally from 03-Oct’s 2855 low enough to warrant a move to the sidelines by long-term players.


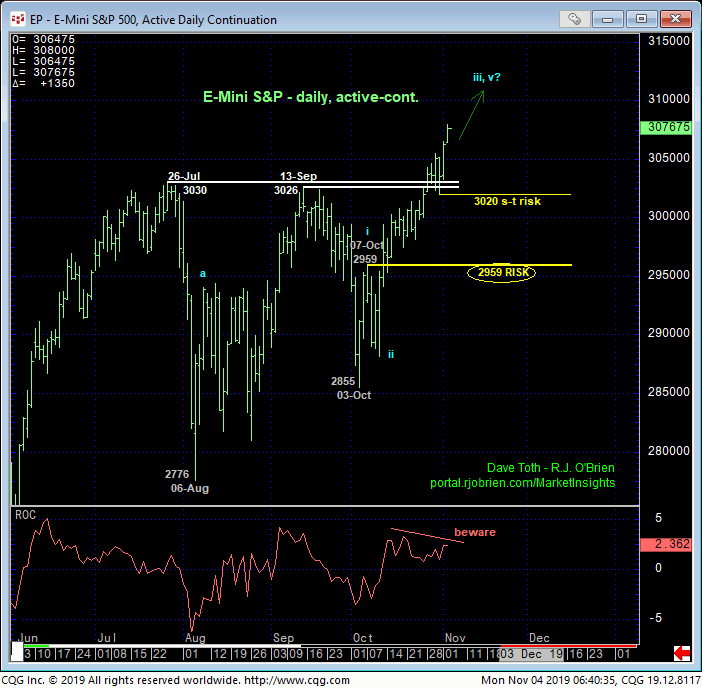
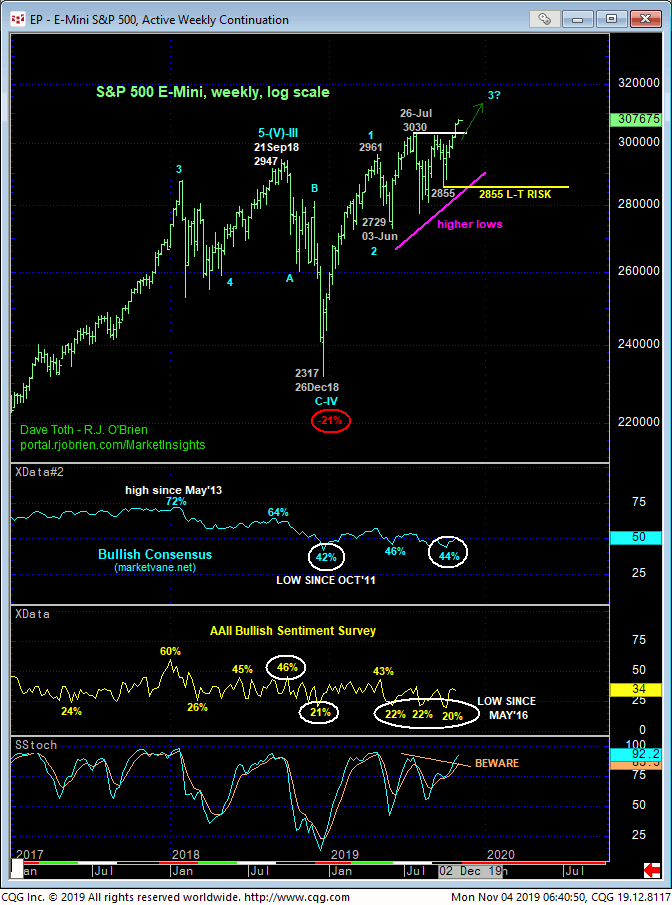
Looking at the daily chart above and weekly log chart below, there’s not a lot to say here. The trend is up on all scales and should not surprise by its continuance OR ACCELERATION with former 3030-area resistance considered new near-term support. Additionally, as we’ve been discussing for weeks, the sentiment/contrary opinion indicators have shown the huddled masses to be at historically BEARISH levels DESPITE the fact that the market has never violated the major uptrend and has persisted in pressuring al-time HIGHS. The extent of this very recent pessimism is typically seen after a major correction or reversal lower like 4Q18’s 21% meltdown and warns of a major reversal higher. The fact that such pessimism persisted while the bull pressured all-time highs warned and continues to warn us of not only higher prices, but potentially steep, accelerated gains.

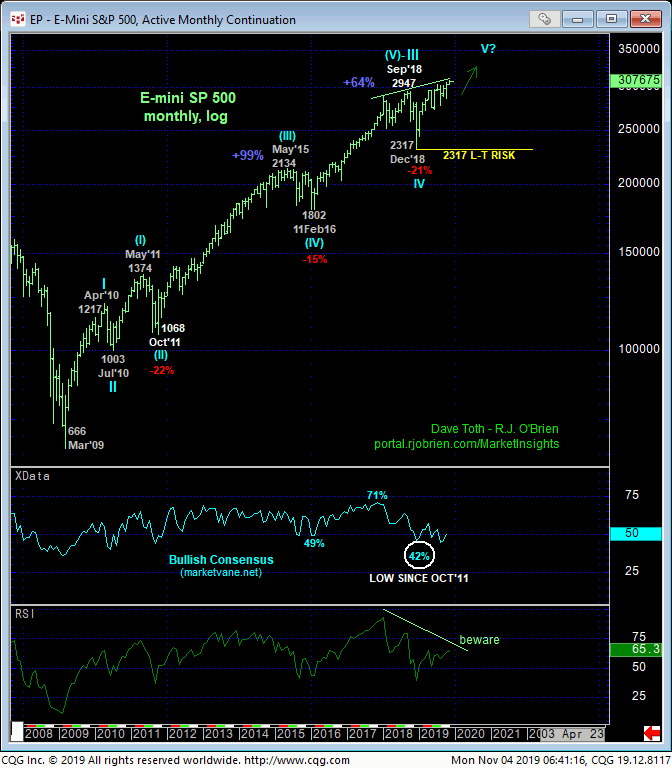
Indeed, looking at the major 15%-to-22% corrections that generated such pessimism since the secular bull resumed from Mar’09’s 666 low, subsequent bull market resumptions of a whopping 99% and 64% unfolded. We’re not forecasting such a stupendous bull resumption from Dec’18’s 2317 low. But we’d be foolish to ignore history and bet against such bullish upside until and unless the market fails below very specific and objective risk parameters at 2959 and even 3020.
These issues considered, a full and aggressive bullish policy and exposure remain advised with a failure below 3020 required for shorter-term traders to step aside and commensurately larger-degree weakness below 2959 for long-term players to take defensive steps. Until and unless such weakness is proven, further and possibly extraordinary gains remain fully expected straight away as there are no resistance levels of any merit above the market.


