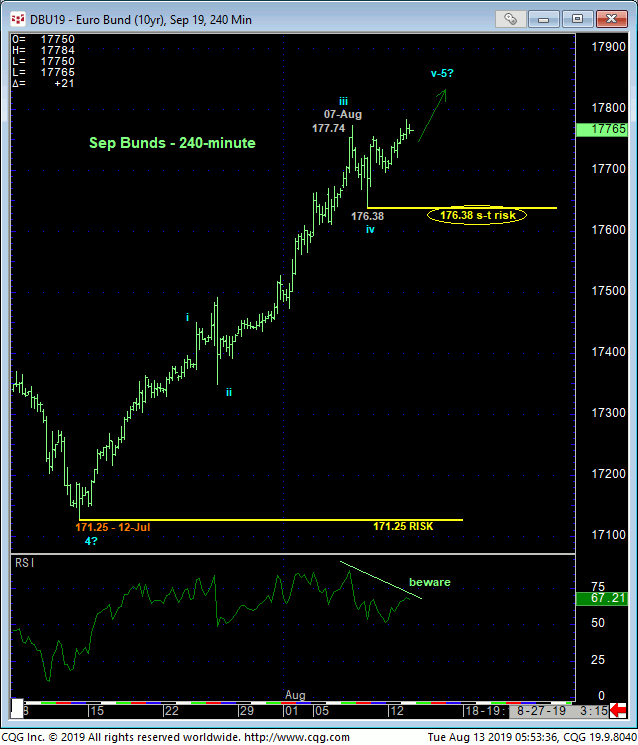
Today’s poke to yet another round of new all-time highs- this time above last week’s 177.74 high detailed in the 240-min chart below- leaves Thur’s 176.38 low in its wake as the latest smaller-degree corrective low this market is now minimally required to fail below to confirm a bearish divergence in short-term mo, stem the rally and expose an interim correction lower. Per such this 176.38 level serves as our new short-term risk parameter from which shorter-term traders with tighter risk profiles can objectively rebase and manage the risk of a still-advised bullish policy.


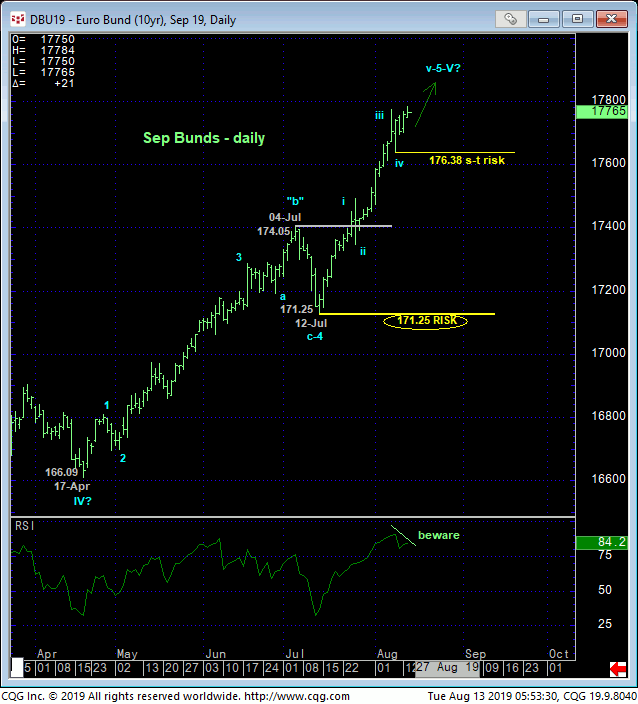
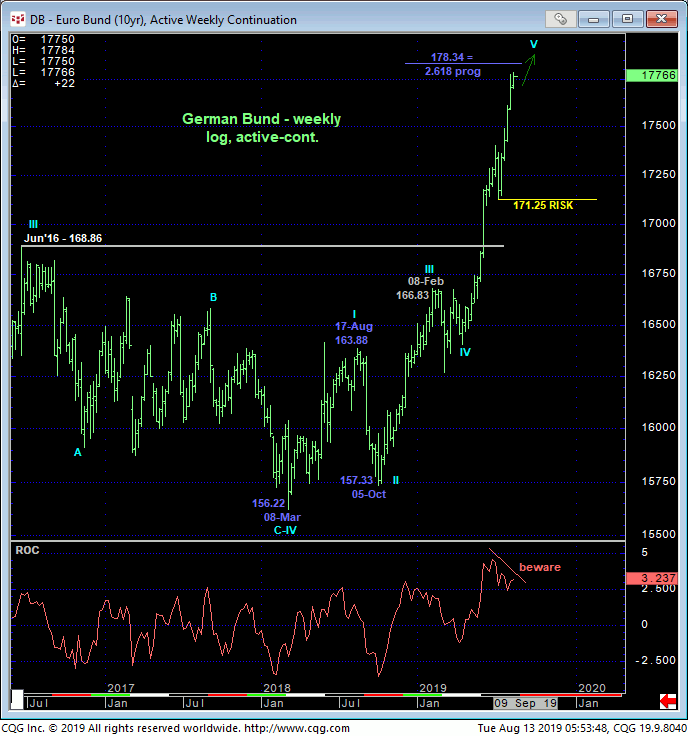
Only a glance at the daily chart above and weekly log chart below is needed to see that the trend remains up on all scales. There remains no resistance above the market as the only levels that can possibly exist where this market has never traded are those merely “derived” from former data points. Such derived levels like imokus, Bollinger Bands, channel lines and even the vaunted Fibonacci progression relationships we cite often in our analysis have NEVER proven to be reliable ways to identify resistance in such an uptrend without an accompanying bearish (in this case) divergence in momentum needing to, in fact, stem the clear and present uptrend. And such a mo failure requires proof of weakness below prior corrective low like 12-Jul’s 171.25 larger-degree corrective low and even an admittedly smaller-degree corrective low and risk parameter like the 176.38 level discussed above. Until and unless such weakness is shown, the trend remains up and should not surprise by its continuance.
Such major, even relentless uptrend also bring out the “overbought” cries simply because any of the momentum indicators are “high”. Understanding that the momentum “tail” never, ever wags the underlying market “dog”, such cries our useless, wrong and outside the bounds of technical discipline. The ONLY technical thing that matters at this juncture is MOMENTUM and a failure below a prior corrective low on a scale commensurate with one’s personal risk profile. Shorter-term traders with tighter risk profiles would use Thur’s “tighter” 176.38 corrective low as the parameter to rebase and manage the risk of a bullish policy. Understanding that such a sub-176.38 failure would only allow us to conclude the end of the portion of the secular advance from 12-Jul’s 171.25 corrective low, this 176.38 risk parameter would be too tight for longer-term players with wider risk profiles who would best use 12-Jul’s 171.25 larger-degree corrective low.
These issues considered, a full and aggressive bullish policy remains advised with a failure below 176.38 required for shorter-term traders to step aside to circumvent the depths unknown of what we’d first suspect is just a slightly larger-degree correction within the secular bull. A commensurately larger-degree failure below 171.25 remains required to threaten the secular bull enough to warrant long-term players’ move to the sidelines. In lieu of such weakness the market’s upside potential remains as indeterminable and potentially severe now as it did a month or two or three ago.


