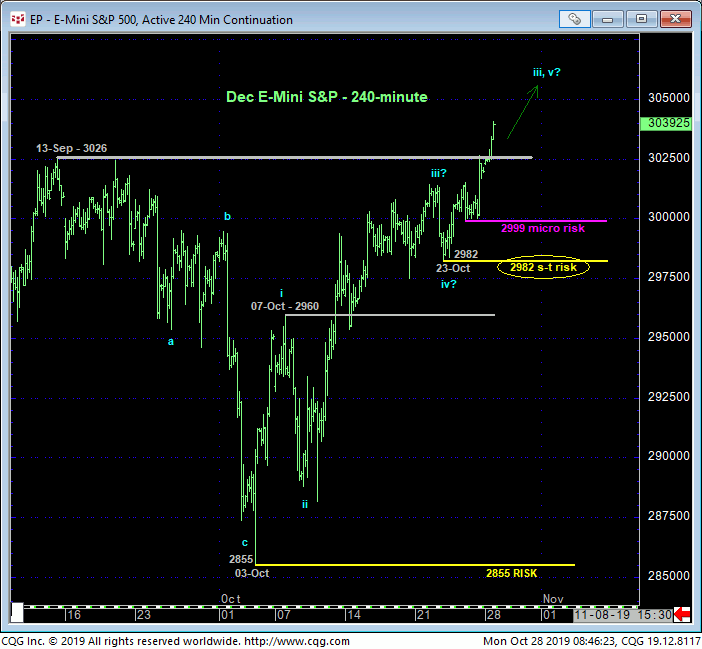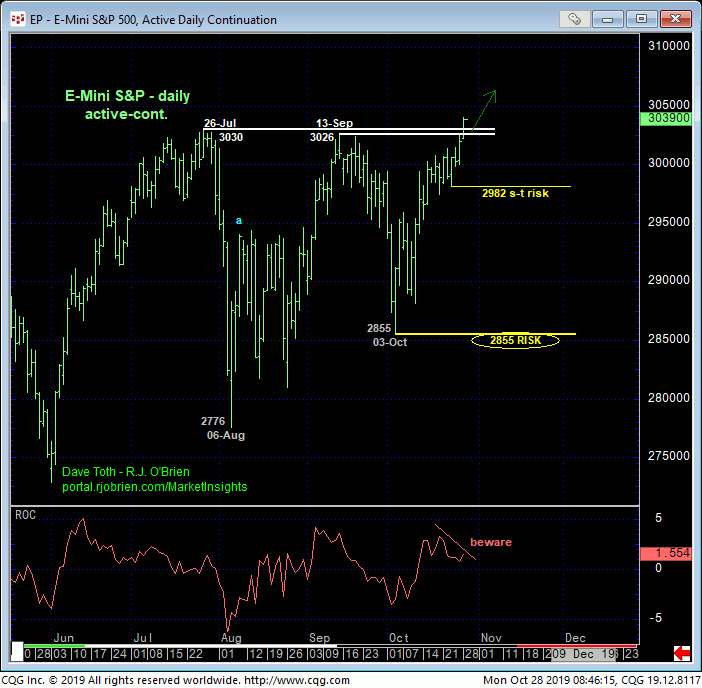

The market’s break today of the past quarter’s resistance defined by the 3026-to-3030-area shown in the daily chart below reinstates the secular bull trend. The 240-min chart below shows that as a direct result of this continued strength, the market has identified corrective lows and risk parameters of various scales at 2999, 2982 and 2855. These levels represent our new micro-, short- and long-term risk parameters to a still-advised bullish policy and exposure.
These corrective lows and former 3030-to-3026-area resistance-turned-support are the ONLY levels of any technical merit. As the market has broken out to new all-time highs, there is no resistance. The trend is up on all scales and should not surprise by its continuance or acceleration. The only levels that exist above the market are “derived” from past data like Bollinger Bands, imokus and Fibonacci progression levels. And as we’ve discussed ad nauseam, such merely derived levels never have proven to be reliable reasons to fade a trend in the absence of a trend-threatening bearish (in this case) divergence in momentum, and they never will. The derived technical level “tail” never, ever wags the underlying market “dog”.
This bull could peak out tomorrow. But we will only get a more verifiable indication of this IF/when the market fails below the corrective lows specified above. Until and unless such weakness is proven, there is no way to know how high “high” is.


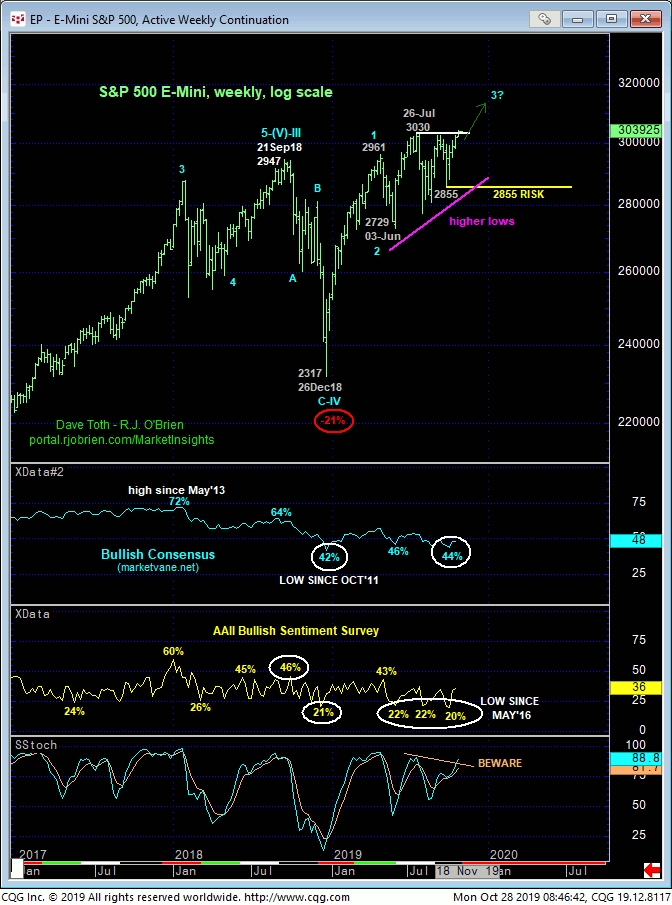
Critical to our continued bullish bias has been and remains the fact that the huddled masses remain historically BEARISH this market DESPITE the fact that the market has been pressuring al-time highs. As recently noted, such pessimism has, in the past, been generated by major corrections of 15% to 22% and is understandable. Such pessimism whilst the market has continued to trend higher, we believe, leaves the market vulnerable to higher, even accelerated gains until and unless threatened by proven weakness below the corrective lows and risk parameters identified above as the huddled bearish masses will eventually be forced to chase this market at higher and increasingly less optimum levels.
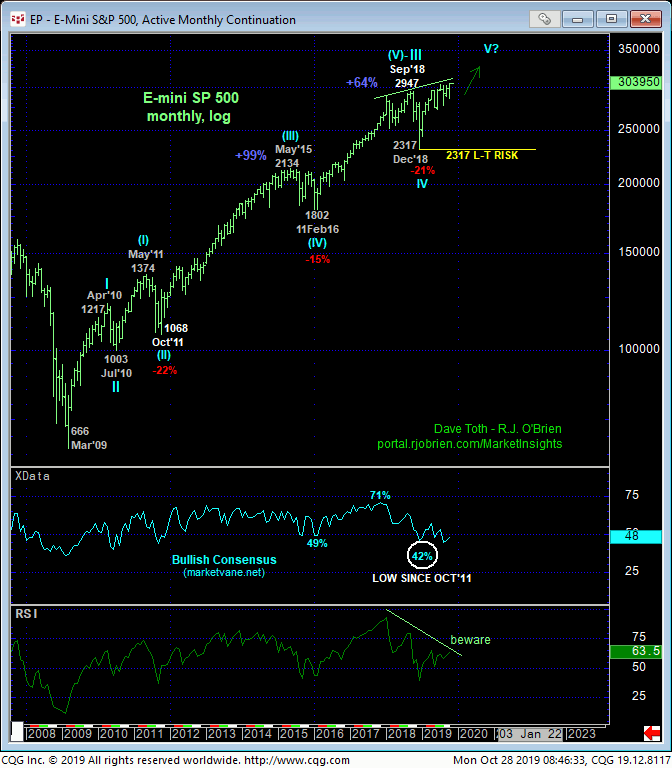
(This is an excerpt from 11-Oct’s Technical Blog that bears repeating): On an even longer-term monthly scale below and while conceding to a slowdown in the rate of ascent over the past 22 months, this market has provided NO evidence to even warn of, let alone confirm a major peak/reversal threat. In fact, for the past 10 YEARS, this market has responded to major corrections like Sep-Dec’18’s 21% correction with nothing short of HUGE, sustained, multi-year gains of at least 64%.
A 64% resumption of the secular bull from Dec’18’s 2317 low projects to around 3,800. Of course, such a forecast from current levels and conditions seems ludicrous and we’re not making such a call. But until and unless this market starts failing below even the minimum levels required to even defer, let alone threaten the secular bull, NO AMOUNT of upside potential above Jul’s 3030 high should be considered off the table given the past 10 years’ technical facts. In other words, the market’s upside potential remains indeterminable and potentially extreme. And we’ve listed with specificity the levels- 2906, 2855 and 2317- this market is required to fail below to defer, threaten or negate a long-term bullish count.
In sum, a full and aggressive bullish policy and exposure remain advised with a failure below 2999 minimally required to even defer, let alone threaten the bull. In lieu of such weakness,further and possibly accelerated gains remain expected.


