JUN20 EURODOLLARS
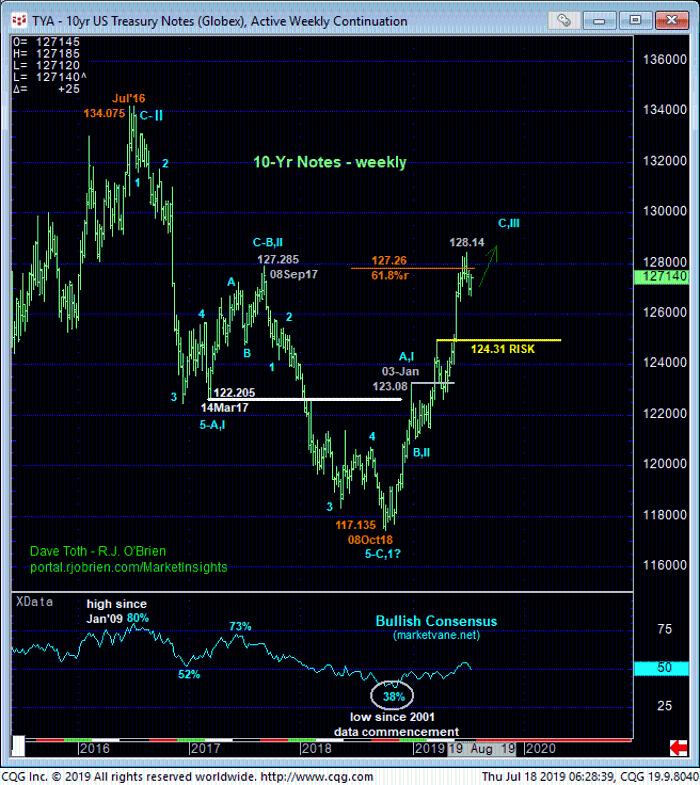
Yesterday’s poke above 10-Jul’s 98.315 initial counter-trend high confirms a bullish divergence in short-term momentum that confirms at east the intermediate-term trend as up and clearly defines 10-Jul’s 98.18 low as one of developing importance and possibly the END of what looks to be only a 3-wave decline from 25-Jun’s 98.50 high as labeled in the 240-m,in chart below. Left unaltered by a relapse below 98.18, that late-Jun/early-Jul setback is easily seen as a corrective/consolidative affair within the still-arguable major uptrend that should not surprise by its resumption. 12-Jul’s 98.225 smaller-degree corrective low is left in the wake of yesterday’s 98.315+ pop and serves as our new short-term risk parameter from which a resumed bullish policy can be objectively rebased and managed by shorter-term traders with tighter risk profiles.
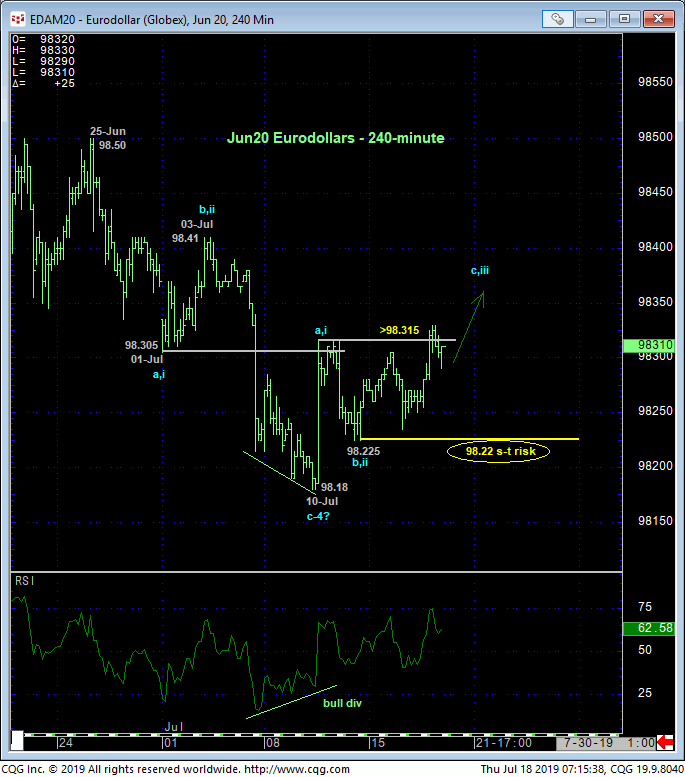
Failing to retrace a Fibonacci minimum 38.2% of even the most recent stage of the major uptrend from 17-Apr’s 97.585 low and remaining well within the bounds of the major up-channel, the late-Jun/early-Jul setback attempt falls well within the bounds of a mere correction ahead of an eventual resumption of the major bull. This said, the fact that 25-Jun’s 98.50 high remain intact as a resistant cap, further lateral, consolidative chop within this 98.50-to-98.18-range should also not come as a surprise to traders in the weeks ahead.
On a broader scale and while a relapse below 98.18 could expose a broader peak/reversal threat, commensurately larger-degree weakness below 27-Mar’s 97.97 suspected 1st-Wave high remains required to jeopardize the impulsive integrity of the major uptrend and warrant a longer-term directional shift.
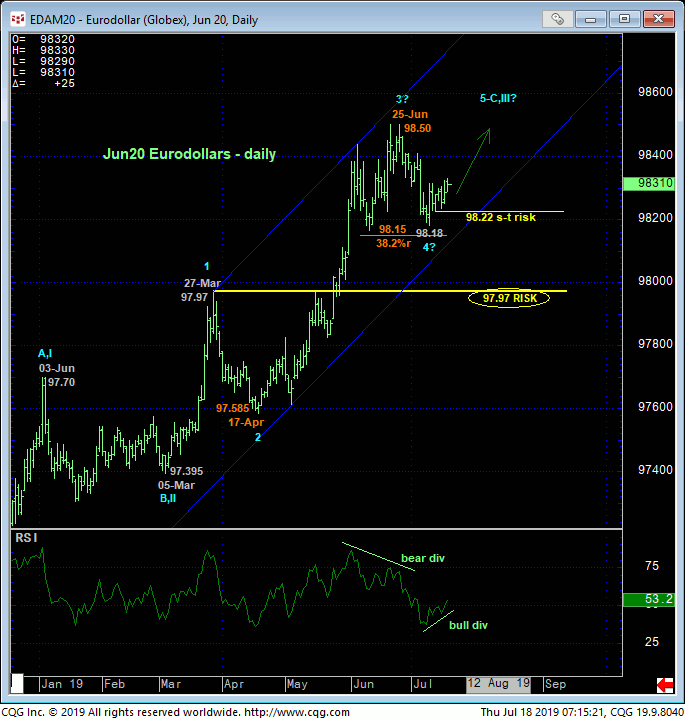
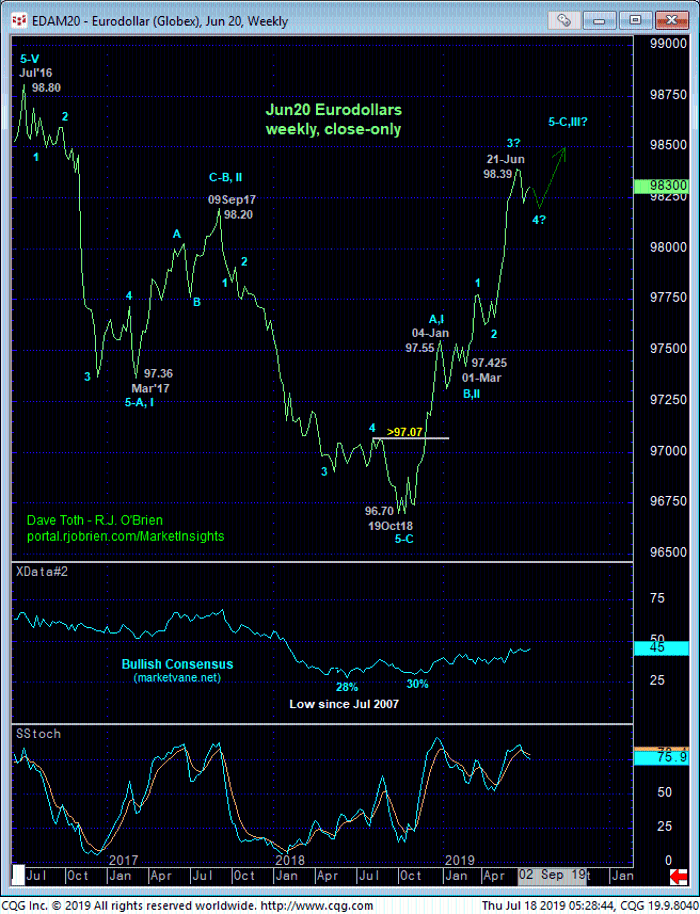
The magnitude of the major uptrend and accelerated (“3rd-wave”) manner of May-Jun’s portion of this bull 1) gives greater odds to this bull remaining intact for quite a while and 2) that it would take a LOT of evidence to the downside in terms of price and/or time to have odds shift in favor of a peak/reversal. Again, on a major monthly scale below, the extent of the recovery from last Oct’s 96.68 low leaves the entire 2016 – 2018 sell-off attempt as a clear 3-wave affair. Against the backdrop of decades of a secular bull trend, this 3-wave sell-off attempt is easily seen as a corrective/consolidative structure that warns of the secular bull’s resumption.
This monthly chart looks virtually identical to the German bund market before the bund recovery “accelerated” in May to blow away its 2016 previous all-time high. A similar bullish result in EDM20 should hardly come as a surprise until and unless threatened by a relapse below at least our long-term risk parameter at 97.97.
These issues considered, a bullish policy remains advised for long-term players with a failure below 98.18 required to pare exposure to more conservative levels and subsequent weakness below 97.97 to jettison the position altogether. Shorter-term traders are advised to return to a bullish policy at-the-market (98.29) with a falure below 98.22 required to negate this specific call and warrant its cover.
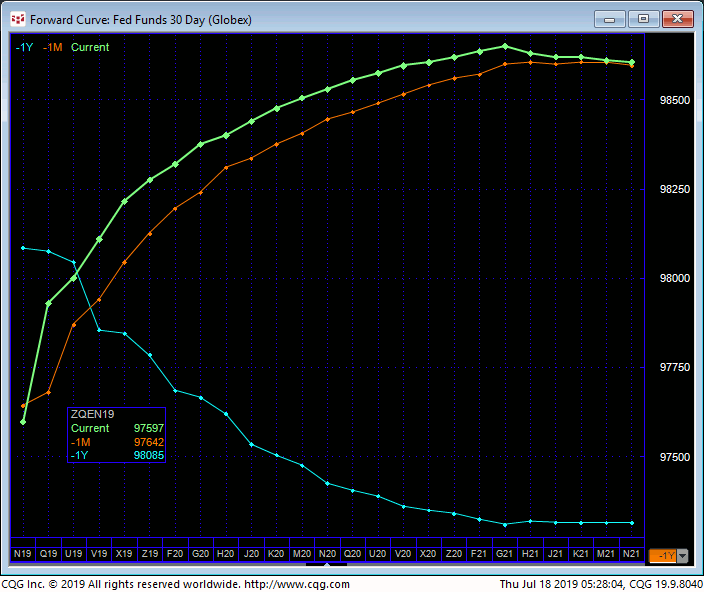
As a final thought, we hear all the time about what kind of Fed move the market is pricing in down the road. As a direct result of the market’s reversal from last Oct’s low, the green and orange lines in the forward curve chart below show that the huddled-mass lemmings are now “forecasting” lower rates/rate cuts in the quarters ahead. The blue line is the forward curve that existed a year ago when the market was in a major downtrend. Throughout summer/fall of 2018, these same masses “priced-in” Fed TIGHTENINGS for the ensuing quarters.
When, in late-Nov/early-Dec, the market confirmed a bullish divergence in weekly momentum that basically broke the major downtrend, the “overall market vigilantes” changed the directional paradigm and warned of higher prices, lower rates and eventual rate CUTS long before the masses and Fed speak included a shift back to easing. That’s a seismic shift of about 130 bps over the past eight or nine months on rates about two years out.
The bottom line we’re inferring on this is to take what the market is “pricing in” for Fed cuts or hikes with a grain of salt. Market sentiment/contrary opinion levels and momentum provide better odds, earlier entry points and preferred risk/reward conditions to key directional moves and eventual Fed follow-up to what the overall market dictates.
 SEP 10-Yr T-NOTES
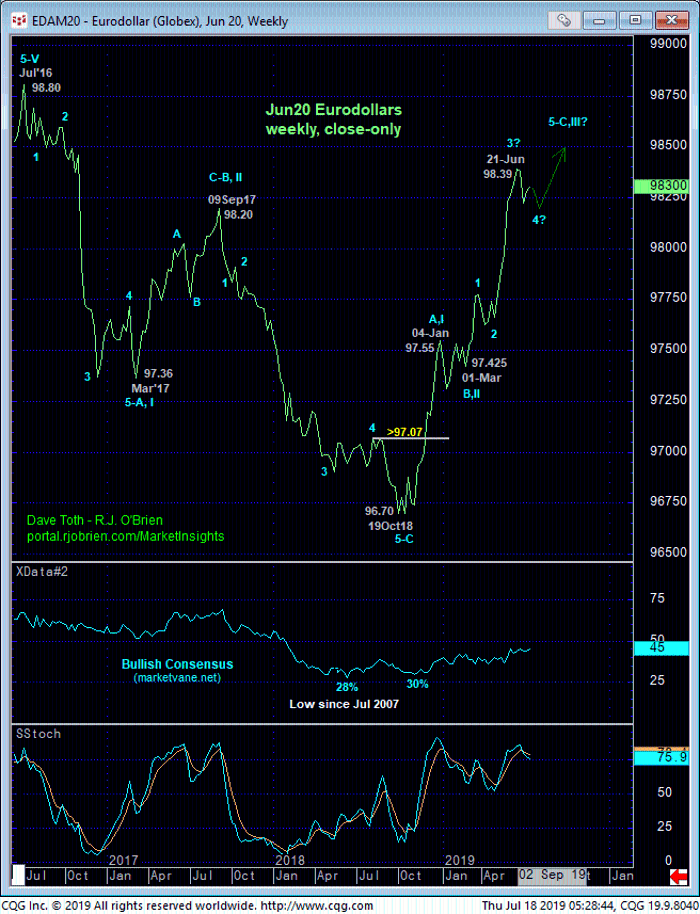
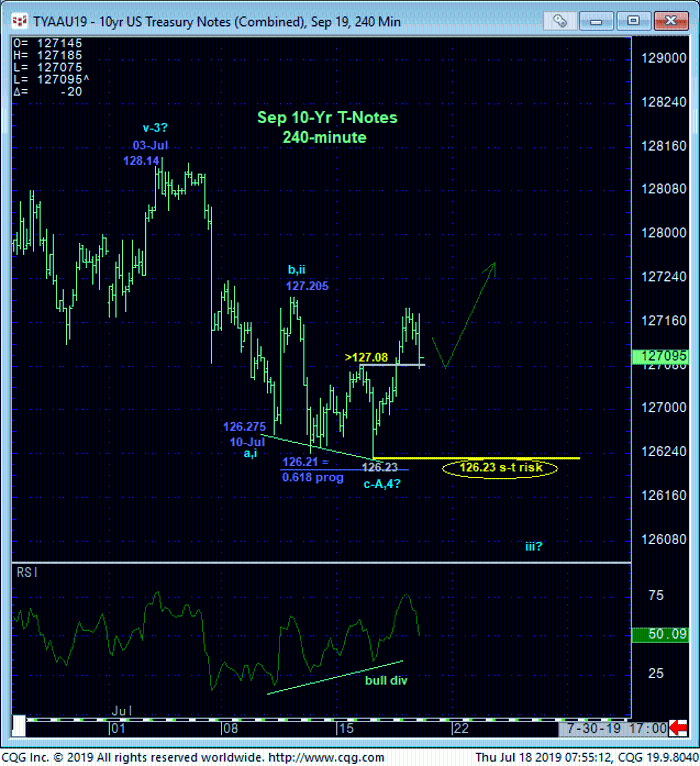
Yesterday’s recovery above Tue’s 127.08 corrective high likewise confirms a bullish divergence in short-term mo that leaves Tue’s 236.23 low in its wake as one of developing importance and possibly the end of a 3-wave and thus corrective decline from 03-Jul’s 128.14 high that might now re-expose the major bull trend. Per such that 126.23 low serves as our new short-term risk parameter from which shorter-term traders with tighter risk profiles can objectively base and manage the risk of a return to a bullish policy.
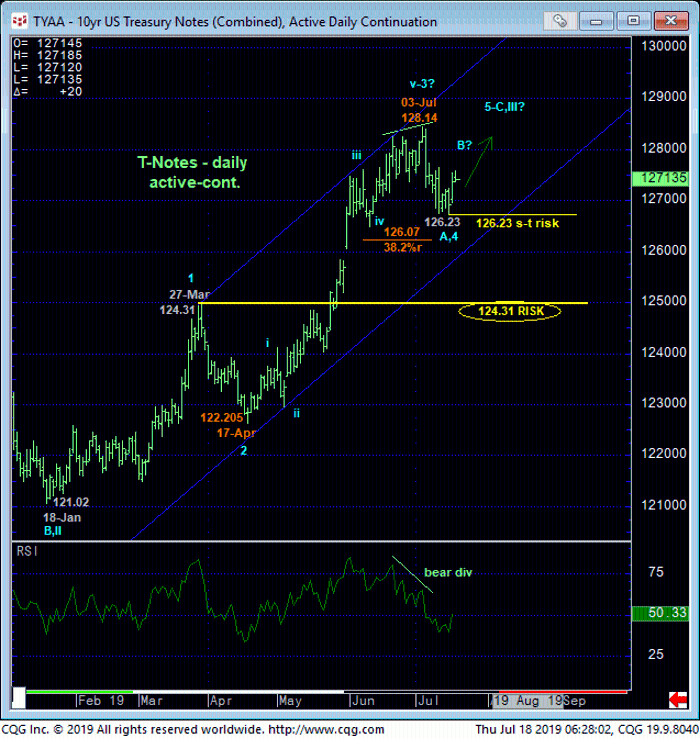 Here too, against the backdrop of a major uptrend shown in the weekly chart below, the relatively minor setback thus far from 03-Jul’s 128.14 falls well within the bounds of a mere correction. Commensurately larger-degree weakness below 27-Mar’s 124.31 (suspected 1st-Wave) high and key long-term risk parameter remains required to jeopardize the impulsive integrity of the major bull and warrant a major directional shift in policy. This said, while 03-Jul’s 128.14 high remains intact as a resistant cap, further intra-128.14-to-126.23-range lateral consolidation could lie ahead.
These issues considered, a bullish policy remains advised for long-term players with a failure below 126.23 required to pare bullish exposure to more conservative levels and subsequent weakness below 124.31 required to jettison the position altogether. Shorter-term traders with tighter risk profiles are advised to reconsider cautious bullish exposure from the 127.05-to-127.00-range with a failure below 126.23 required to negate this specific call and warrant its cover.
