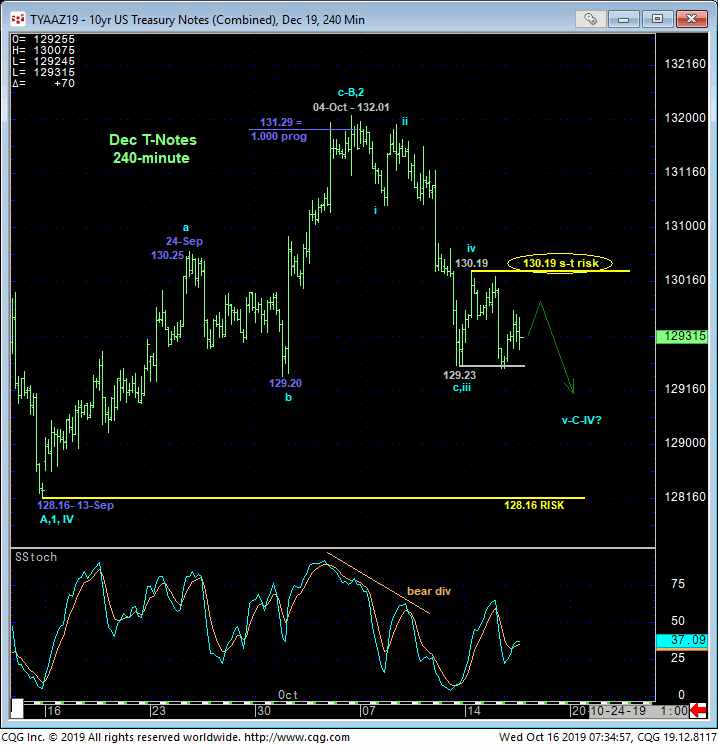
DEC 10-Yr T-NOTES
While it was only a little nibble yesterday below Fri’s 129.23 low, the market has nonetheless identified Mon’s 130.19 high as the end or upper boundary of the latest smaller-degree correction and the minimum level this market now needs to recoup to defer or threaten a more immediate bearish count. Per such, shorter-term traders with tighter risk profiles are advised to consider this 130.19 level as our new short-term risk parameter from which non-bullish decisions like long-covers and cautious bearish punts can be objectively rebased and managed.
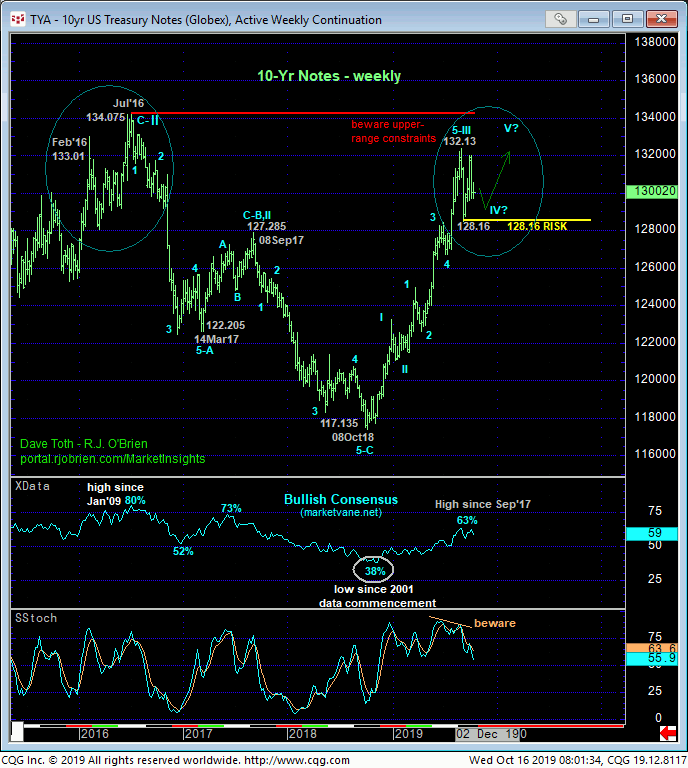
From a longer-term perspective however, 13-Sep’s 128.16 low remains intact as our key long-term risk parameter this market is still required to break to expose a peak/correction/reversal threat that could be major in scope given the market’s recent proximity to the extreme upper recesses of the past three years’ range shown in the weekly chart below. We discussed in 01-Oct’s Technical Blog the prospect that the so-called easy-money from a trendier environment the market has enjoyed since Dec’18 is likely over as the market encroaches on Jul’16’s all-time high and the resistance that comes with such historically low rates. This doesn’t mean the major bull trend is over, but rather that continued gains are likely to be more labored with the market failing to sustain such new highs. The price action that followed Feb’16’s 13.01 high circled in the weekly chart below shows what we believe this market may be in store for in the months and perhaps even quarters ahead.
A particular challenge will come if/when the market breaks 13-Sep’s 128.16 low like the German bund market did this week by taking out its 13-Sep low. Such a break could still be part of a broader bull market correction. But RELYING on such a bullish count below a key threshold like 128.16 is bucking the trend and trying to catch the proverbial falling knife. We don’t do that because if that call is wrong and the market tanks in a 3rd-wave reversal, you’re dead. Rather, we much prefer to exchange whipsaw risk by stepping aside from bullish exposure and re-establishing that bullish exposure IF/when the market stems that decline with a confirmed bullish divergence in momentum needed to reject/define a more reliable market-defined low and support from which the risk of a resumed bullish play can only then be objectively based and managed.
UNTIL that 128.16 low is violated however, the current relapse from 04-Oct’s 132.01 high is considered the C-Wave of a lateral bull-flag consolidation from 03-Sep’s 132.13 high where a confirmed bullish in short-term mo from a level north of 128.16 may present an excellent risk/reward buying opportunity for shorter-term traders.
These issues considered, a neutral-to-cautiously-bearish stance remains OK for shorter-term traders with a recovery above 130.19 required to negate this call and tilt intra-range directional scales higher. A bullish policy remains advised for long-term players with a failure below 128.16 required to threaten this call enough to warrant moving immediately to a neutral/sideline position to circumvent the depths unknown of a larger-degree correction or perhaps even a major reversal lower. In effect, we believe the market has identified 128.16 and 130.19 as the key directional triggers heading forward.
DEC GERMAN BUNDS
Yesterday’s break below Fri’s 172.08 low reaffirms our bearish count discussed in 10-Oct’s Technical Blog and leaves smaller- and larger-degree corrective highs in its wake at 172.94 and 174.997, respectively, that now serve as our new short- and longer-term risk parameters from which non-bullish decisions like long-covers and cautious bearish punts can be objectively based and managed. Former 172.10-to-172.30-area support would be expected to hold as new resistance per any broader bearish count.
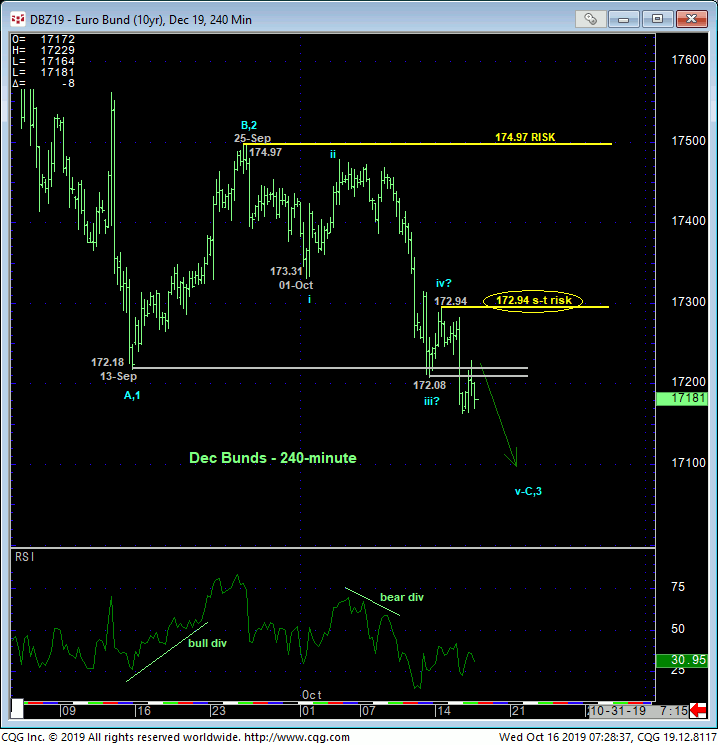
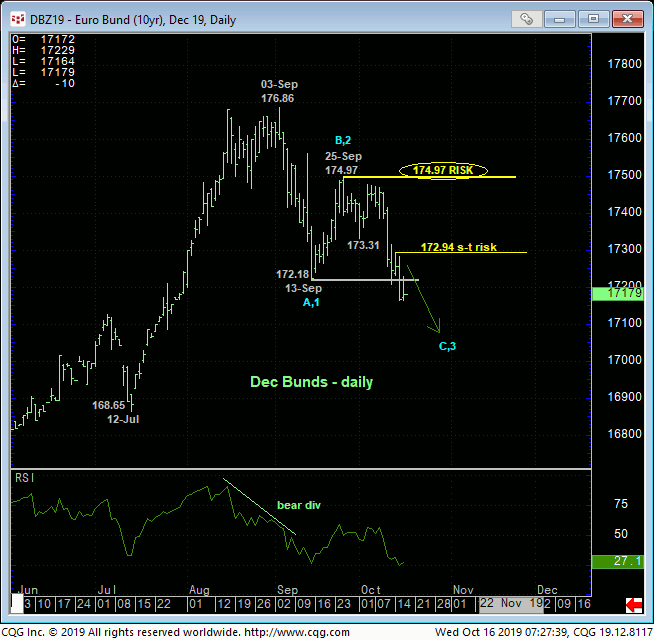
Yesterday/today’s break below 13-Sep’s 172.18 low clearly exposes the new long-term trend as down. While the resumed decline from 25-Sep’s 174.97 high could be the completing C-Wave of a broader BULL market correction, at this exact juncture there’s no way to know that this portion of the decline isn’t the dramatic 3rd-Wave of a peak/reversal process that could be major in scope.
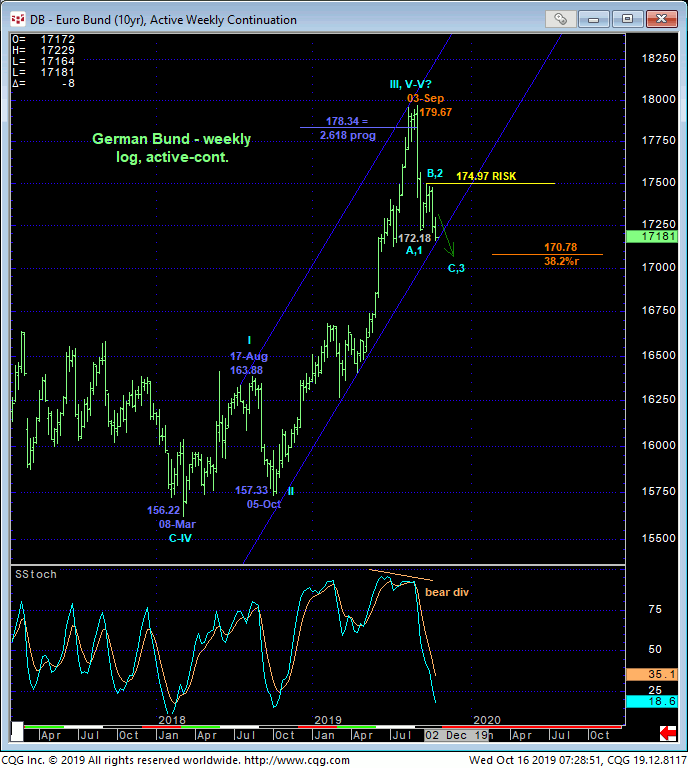
The bearish count would be expected to be characterized by continued, sustained and STEEP, even relentless losses straight away. Indeed, only a glance at the weekly log chart below shows that there are NO levels of any technical merit below the market shy of former 166-handle-area resistance from Feb-Mar as a new support candidate. Traders are reminded that merely “derived” levels like channel lines, Bollinger Bands, imokus and the ever-useless moving averages never have been reliable reasons to try to catch the falling knife, and they never will be.
What we know with specificity is where the market should NOT trade per any broader bearish count: above 172.94 initially, and then above 174.97. Until and unless such strength is shown, further and possibly protracted losses should not surprise straight away. Per such, all previously recommended bullish policy for long-term players has been nullified, warranting a neutral-to-cautious-bearish policy from 172.0 OB with a recovery above 172.94 threatening this call enough to warrant its cover ahead of a possible resumption of the secular bull trend Shorter-term traders remain advised to maintain a cautious bearish policy with strength above 172.94 required to negate this call and warrant its cover.
JUN20 EURODOLLARS
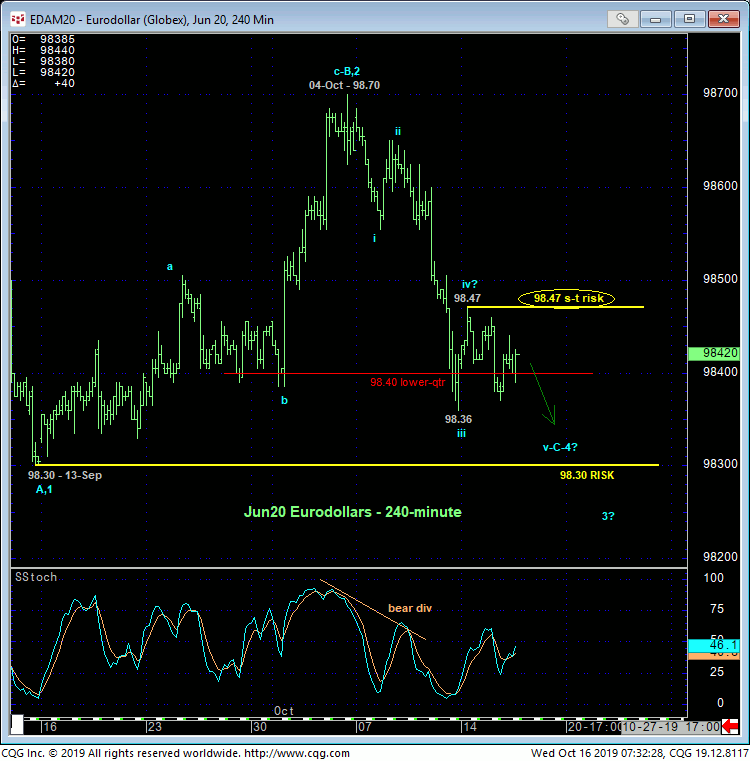
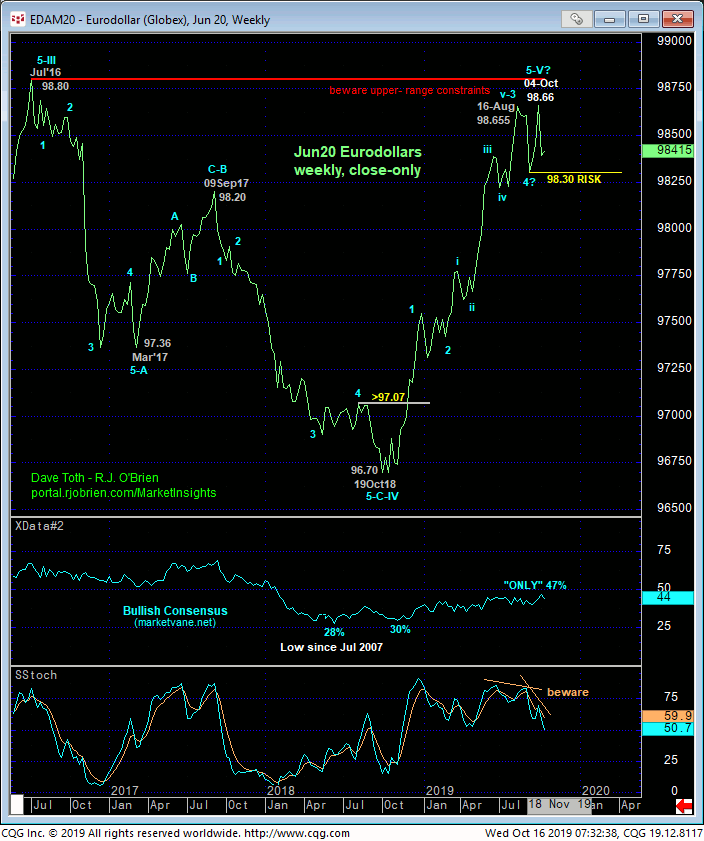
The technical construct and expectations for the Eurodollar market are identical to those detailed above for T-notes with Mon’s 98.47 high considered our new short-term risk parameter for a cautious bearish policy for short-term traders and 13-Sep’s 98.30 low still intact as our key long-term risk parameter for a still-advised bullish policy for long-term players.
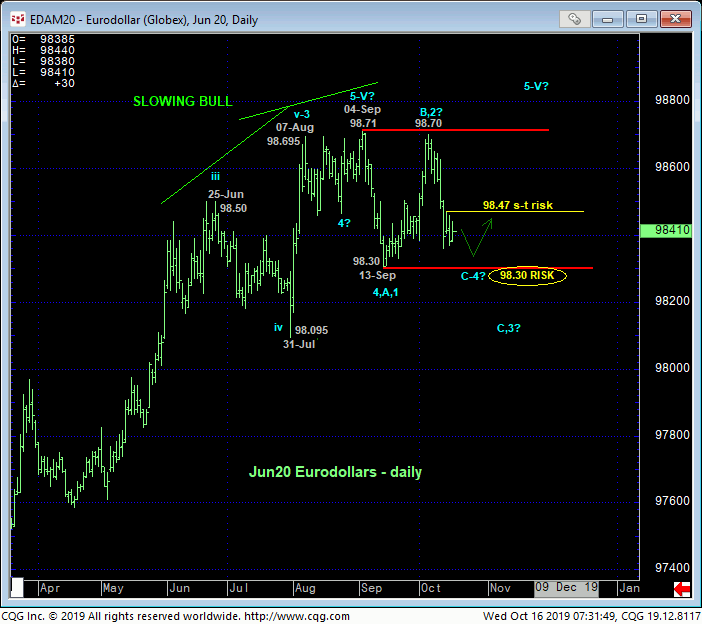
The daily chart above shows the strength of the bull trend waning since mid-Jun. This is understandable given the market’s encroachment on Jul’16’s 98.80 al-time high weekly close shown in the weekly close-only chart below. In sum, a bullish policy remains advised for long-term players with a failure below 98.30 required to move to the sidelines ahead of a correction or reversal lower that could be major in scope. A cautious bearish stance remains OK for short-term traders with a recovery above 98.47 required to negate this call, warrant its cover and expose at least another intra-range rebound and possibly the resumption of the secular bull trend.
