Posted on Feb 14, 2024, 09:03 by Dave Toth
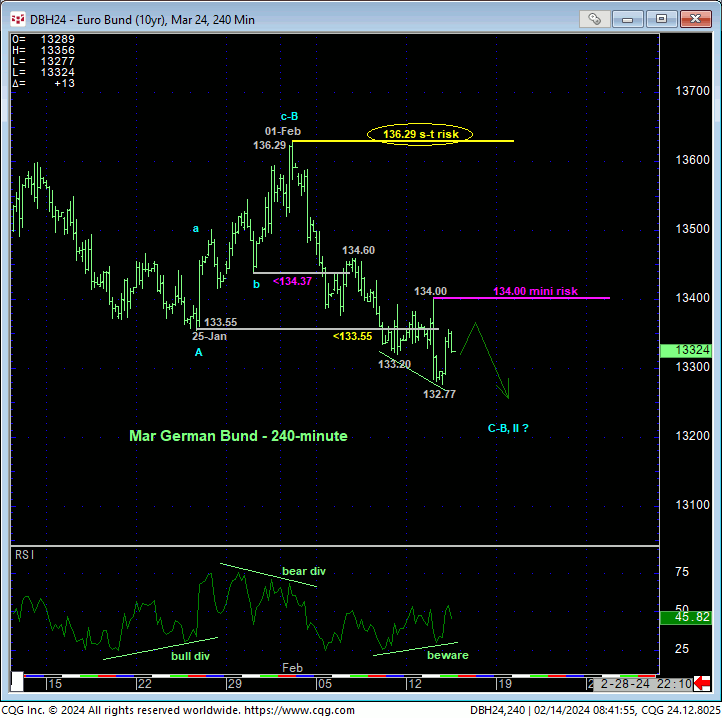
Yesterday’s break below Fri’s 133.20 low reaffirms our peak/correction count introduced in 02-Jan’s Technical Blog and leaves yesterday’s 134.00 high in its wake as the latest smaller-degree corrective high this market is now minimally required to recoup to confirm a bullish divergence in short-term momentum and end at least the portion of the month-and-a-half decline from 01-Feb’s 136.29 next larger-degree corrective high. Per such, we’re defining 134.00 as our new mini parameter from which short-term traders can objectively rebase and manage the risk of a still-advised bearish policy and exposure. Until/unless such minimum strength is confirmed, the risk of further and possibly accelerated losses remains.

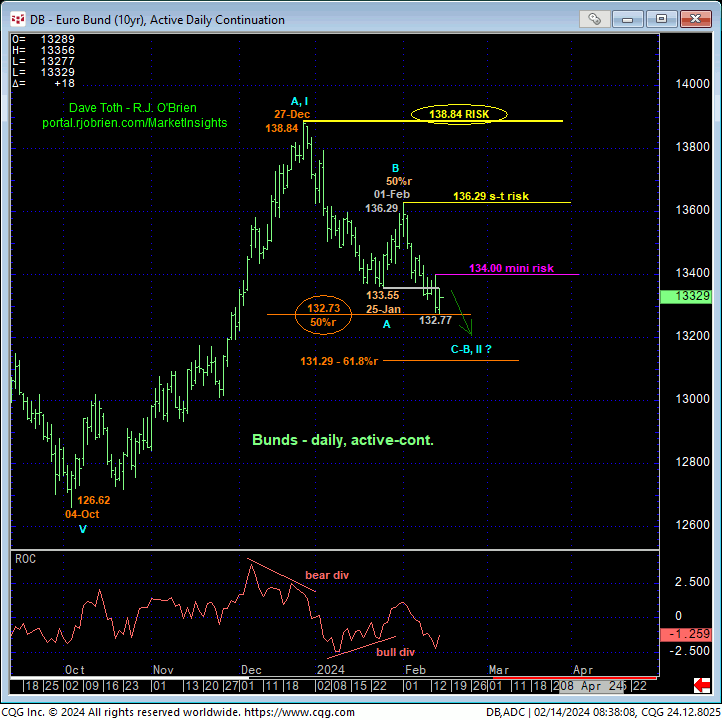
Moving out to a daily scale, the chart below shows the suspected (B- or 2nd-Wave) correction of Oct-Dec’s (A- or 1st-Wave) rally from 126.62 to 138.84 within what we believe is a major BASE/reversal process to counter the secular 3-YEAR bear market. To confirm the decline from 27-Dec’s obviously pivotal 138.,84 high as a 3-wave and thus corrective structure, the market needs to prove commensurately larger-degree strength above 01-Feb’s 136.29 larger-degree corrective high. Per such, this 136.29 level remains intact as a bear risk parameter for short-to-intermediate-term players.
Such a +136.29 requirement also heightens the importance of yesterday’s 134.00 smaller-degree corrective high and mini bear risk parameter. For to confirm that larger-degree bullish divergence in momentum, the market’s gotta start with a short-term bull divergence above 134.00. What also makes yesterday’s 134.00 high a very short-term but important threshold is that today’s 132.77 low is only a few ticks removed from the (132.73) 50% retrace of Oct-Dec’s 126.62 – 138.84 rally. However, until and unless this market proves strength above at least 134.00 the fact of the technical matter is that the simple downtrend pattern of lower lows and lower highs remains intact and could easily ACCELERATE straight away in a more protracted correction of Oct-Dec’s rally, where the 61.8% retrace doesn’t cut across until the 131.29-area.

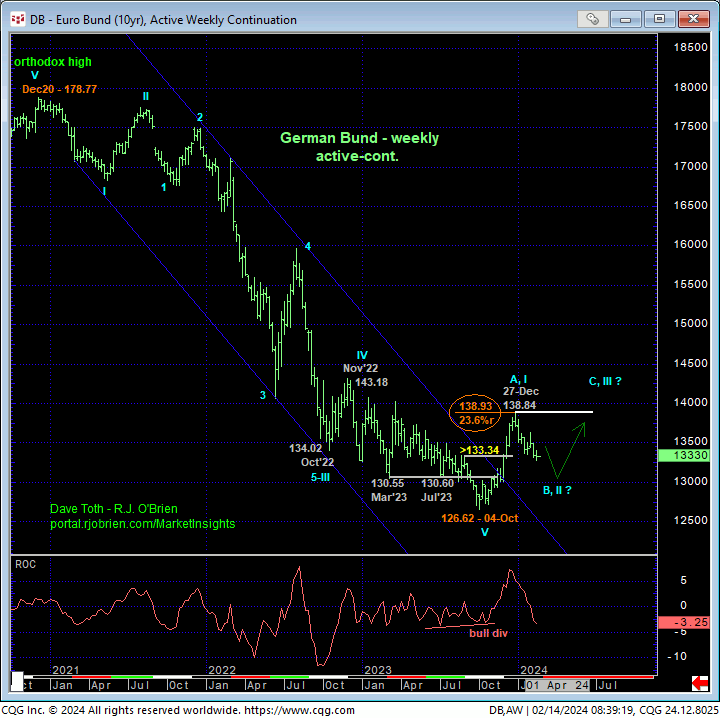
Lastly and on an even broader scale, the weekly chart below shows the elements on which our major BASE/correction/reversal count is predicated:
- a confirmed bullish divergence in weekly momentum
- the market’s gross failure to sustain Sep/Oct losses below a ton of former support-turned-resistance around the 130-handle-area
- an arguably textbook complete and massive 5-wave Elliott sequence down from Dec’20’s 178.77 orthodox high, and
- Oct-Dec’s initial impulsive 5-wave rally.
Until/unless negated by commensurately larger-degree weakness below 04Oct23’s 126.62 low, this current setback attempt from 27-Dec’s 138.84 high is considered a B- or 2nd-Wave correction of Oct-Dec’s A- or 1st-Wave rally that ultimately could produce one of THE KEY and favorable risk/reward opportunities from the BUY SIDE for what would be expected to be a major C- or 3rd-Wave rally the remainder of the year to levels well above 138.84. To set up that favorable risk/reward buy however, the market needs to arrest the clear and present downtrend with a bullish divergence in momentum. Until/unless such a mo failure stems the slide, its remining extent is indeterminable and potentially extreme.
These issues considered, a bearish policy and exposure remain advised with strength above at least 134.00 and preferably 136.29 required to pare or neutralize exposure commensurate with one’s personal risk profile. In lieu of such strength, further and possibly accelerated losses should not surprise straight away.


