Posted on Oct 26, 2023, 09:37 by Dave Toth
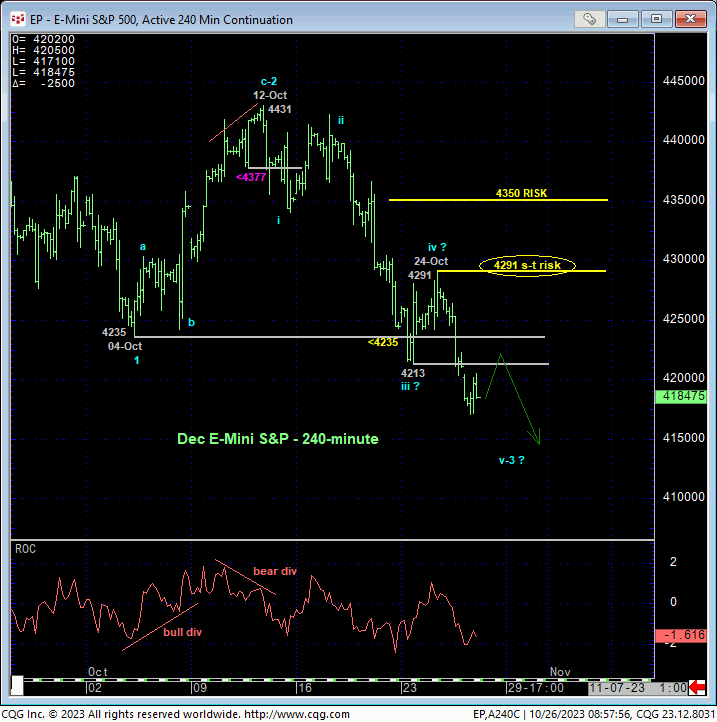
Yesterday’s break below Mon’s 4213 low reaffirms our major peak/reversal count and sell recommended in 12-Oct’s Trade Strategies Blog and leaves Tue’s 4291 high in its wake as the latest smaller-degree corrective high this market is now minimally required to recoup to defer or threaten this call. Per such, we’re defining 4291 as our new short-term parameter from which shorter-term traders with tighter risk profiles can objectively rebase and manage the risk of a bearish policy and exposure.
Now-former 4213-to-4235-area support, since broken, is considered new near-term resistance ahead of further and possibly protracted losses straight away.


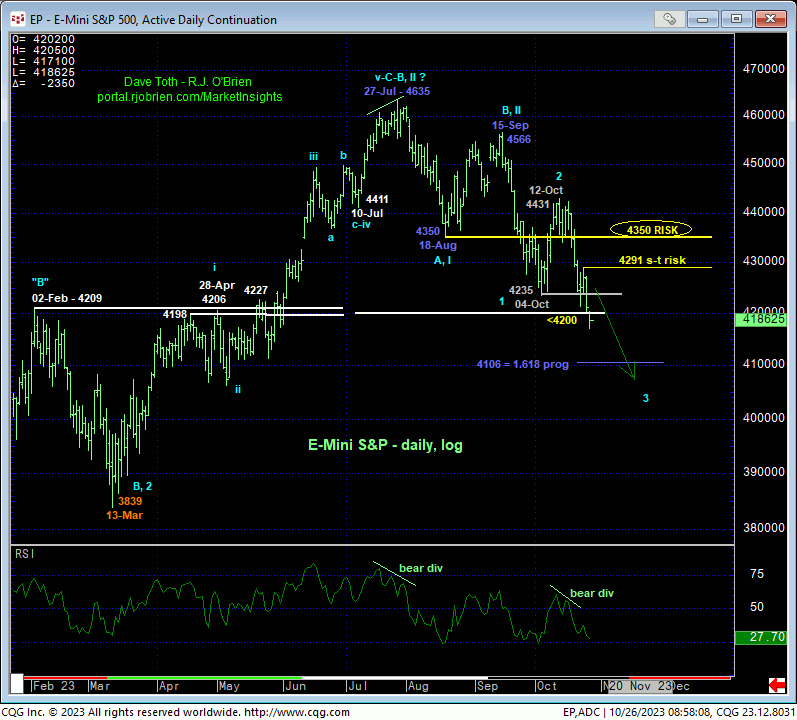
On a broader scale, we’ve discussed the general 4200-“area” as a key former resistance-turned-support area and condition. On a daily log high-low chart above, the market has broken below this area that capped this market has major resistance from early-Feb until early-Jun’s bust out above it, rendering it a key new support candidate. As we’ll show further below in the weekly chart, by failing below this area, odds increase even further that the entire recovery attempt from Oct’22’s 3502 low is a 3-wave and thus corrective event that warns of a resumption of Jan-Oct22’s major bear trend that preceded it.
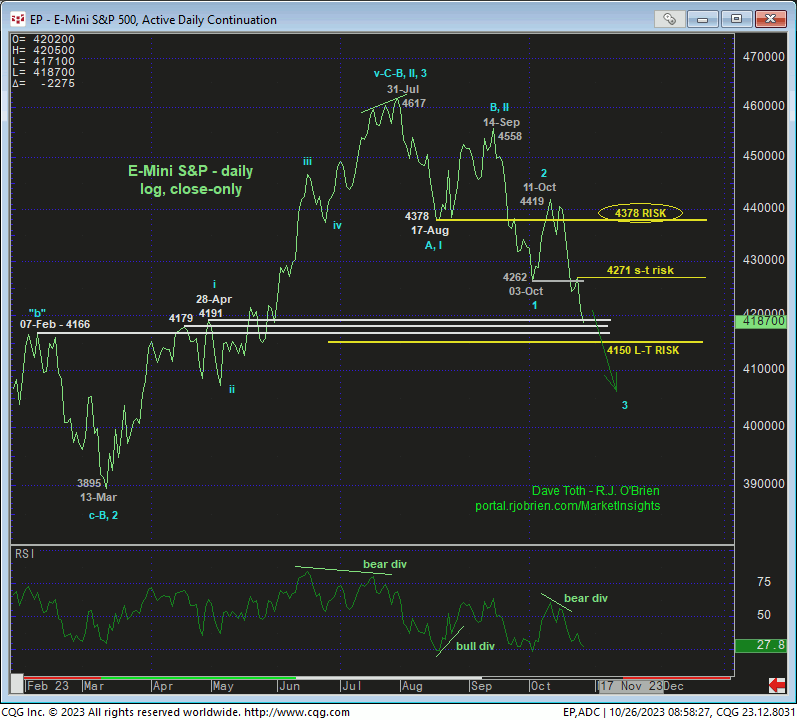
Trying to eliminate intra-day “noise”, the daily log close-only chart below shows this critical “area” or threshold ranging from 4191-to-4166. Trying to find a bullish fly in the broader bearish ointment, we believe a daily close around the 4150 area would be the final nail in any bull’s coffin and confirm a peak/reversal environment that could be major in scope, exposing at least a return to the lower-quarter of the past 22-month range between 3825-and-3502 if not a major breakdown below last year’s 3502 low.
On a short-term basis, we’ve identified Mon’s 4291 high as a MINIMUM level this market needs to recoup to even defer the bear. On a larger-degree scale, we’re identifying the 4350-to-4378-range as the area this market needs to recoup to threaten a more immediate bearish count to the point of non-bearish behavior like short-covers for longer-term institutional players and investors. This area represents the suspected 1st-Wave lows from 17-/18-Apr that the market would NOT be expected to recover above per our more immediate bearish count as this would jeopardize the impulsive integrity of a major 5-wave Elliott sequence down from 27-Jul’s 4635 high.
Again, IF IF IF this bearish count is wrong, the market absolutely needs to recover above at least a corrective high like 4291 and preferably the 4350-to-4378-area. Until and unless such strength is shown, the trend is down on all practical scales and should not surprise by its continuance OR ACCELERATION straight away.

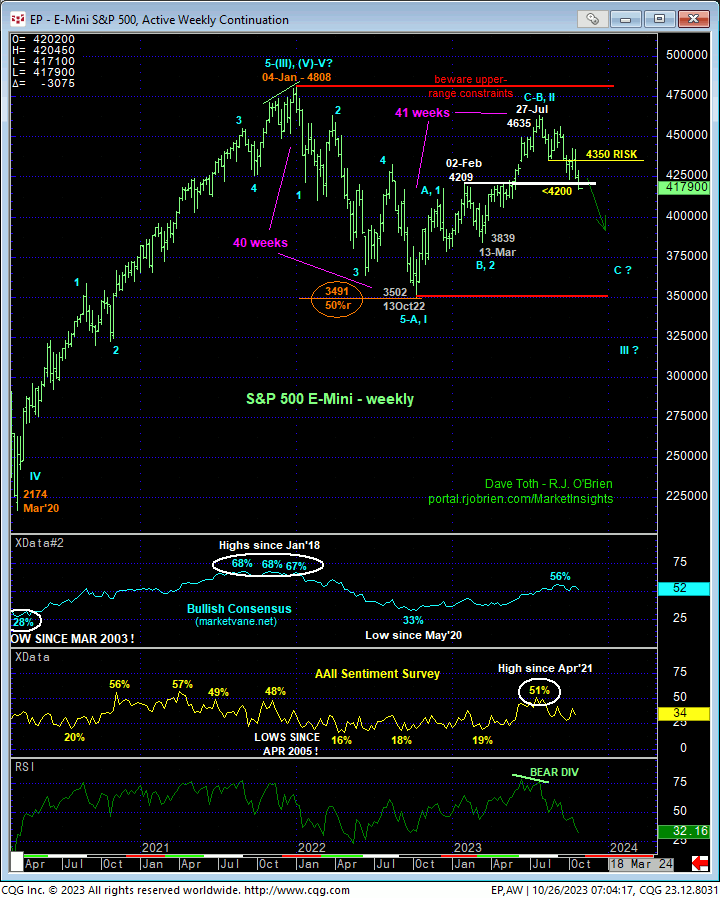
Finally, the weekly log chart below shows:
- the market’s total rejection of the extreme upper recesses of 2022/23’s range we warned of in 02-Aug’s Technical Blog
- 17-Aug’s bearish divergence in WEEKLY momentum below 10-Jul’s 4411 corrective low
- then-historically frothy sentiment/contrary opinion levels
- Oct’22 – Jul’23 recovery attempt that spanned an identical length of time (41 weeks) to Jan-Ovt’22’s 40-week decline
- a 3-wave and thus corrective structure from Oct’22’s 3502 low to 27-Jul’s 4635 high.
Together, these technical facts warn of at least the continuation of a major, multi-quarter consolidation/corrective from Jan’22’s 4808 all-time high that could easily revert to the lower-quarter of the 2022/23-range between 3825-and-3502. As no one can RELY on any level “down there” to hold however, the current downtrend’s downside potential must be approached as indeterminable and potentially extreme, including a break of last year’s 3502 low, until/unless deferred or threatened by recoveries above 4291 and especially the 4350-to-4378-range. And below 3502 are NO levels of any technical merit to look to as a support candidate. If the market breaks 3502, the reaffirmed secular bear market would likely be devastating.
These issues considered, a full and aggressive bearish policy and exposure remain advised with a recovery above at least 4291 required for shorter-term traders to take profits and stand aside and commensurately larger-degree strength above the 4350-to-4378-range for longer-term institutional players and investors to follow suit. In lieu of such strength, further and possibly steep, accelerated, even relentless losses should not surprise straight away.


