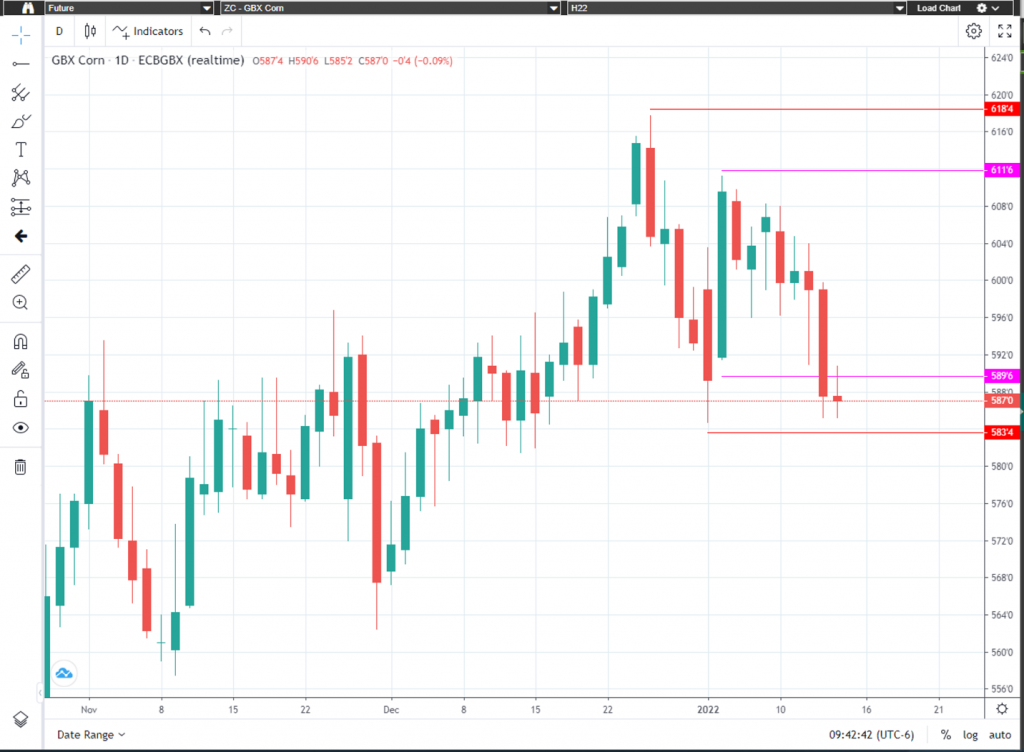

On January 7th I advised traders on the following “Today I would advise traders to watch for another breakout” “I believe short term aggressive levels are $6.11 ¾ on the upside and $5.89 ¾ on the downside and the medium term breakout levels are $6.18 ½ upside and $5.83 ½ on the downside.” Let’s take a look at what has happened since last Friday. March corn started off the week continuing to consolidate between the short-term breakout levels I mentioned last Friday until yesterday. On Wednesday the USDA Crop Report was fairly in line with expectations and generally considered a nonevent. Yesterday, we saw a broad-based selloff which pressured corn and took it below $5.89 ¾ triggering a short term sell for aggressive traders. Traders should watch to see if March Corn trades below $5.83 ½ , if it does, we could see additional downside pressure. Big picture I still remain bullish, but traders should remain alert to potential selloffs.
The “big picture” numbers remain the same and probably will for some time. I firmly believe a break below $4.96 could give the bears control of the market and a break above $6.39 ½ on the upside may have enough bulls behind it to propel corn to all-time highs. There are several minor areas of support and resistance inside this range that can help with short term market direction if violated. Call me directly at 1-800-367-7290 for more in-depth discussion on these numbers and to discuss trading strategies specific to your situation.
I would suggest using an option strategy to manage your futures position risk or an outright option strategy. Implied option volatility has come down quite a bit from its most recent highs mainly due to the consolidation and tighter trading ranges. I have 25 years of grain market experience, feel free to call or email with any questions you may have. Be sure to check out my archived weekly grain market insight articles posted on our website.
**** Reserve your FREE 2022 Commodity Trading Guide Today! ****
This 55-page guide is packed with indispensable market information. It has a complete commodity calendar that lists the dates and times of Market Reports, option expiration dates, futures first notice dates, futures last trade dates, etc. It readily serves as your commodity market encyclopedia giving you an in depth look at each commodity, there is market almanac for all actively traded commodities and much more! To reserve your complimentary Commodity Trading Guide, send me an email at msabo@rjofutures.com with the following information: your full name, mailing address and a preferred phone number so we can confirm your request. Once confirmed, I will reserve your trading guide, and have it sent out as soon as we receive them.