Posted on Jan 03, 2024, 10:30 by Dave Toth
Over the past 20 months or so, we’ve navigated some massive peak/reversal processes, ending secular bull markets from 2020’s COVID depths and starting new secular bear markets. Starting with the entire ag complex and hogs in the spring of 2022 and more recently in cattle and sugar. With similar, long-term peak/reversal elements typical of such major peak/reversal environments, we now turn our long-term peak/reversal attention to the cocoa market.
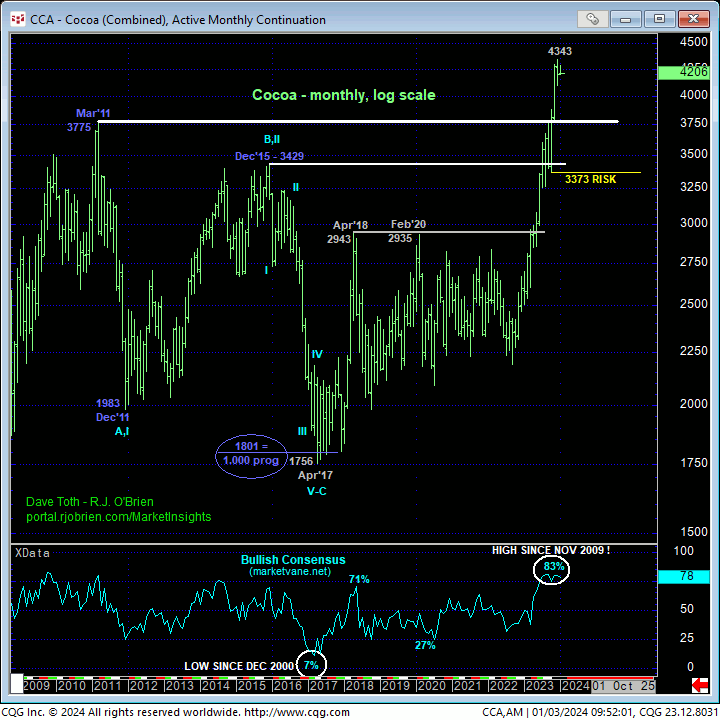
Only a glance at the monthly log chart below is needed to see the enormity of the secular bull market that dates from Apr’17’s 1756 low. This mega-bull has blown away Mar 2011’s former all-time high and exposed an area totally devoid of any technical levels of merit, save for a very, very short-term from last week at 4343 that we’ll address below.
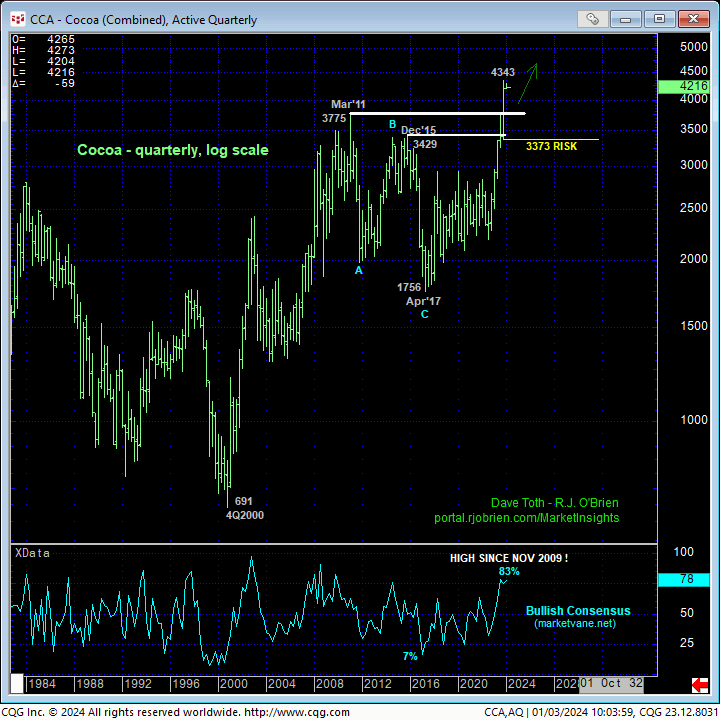
Moreover, 4Q23’s continued rally reaffirms a 23-YEAR secular bull market that dates from 4Q2000’s 691 low shown in the quarterly log scale chart below. This is a massive, massive secular bull market that, by blowing away the now-former 3429-to-3775-area resistance from the past 12 YEARS, renders this entire area as a pivotal new long-term support area the market would/should be expected to sustain gains above to maintain the risk/reward metrics of a continued long-term bullish policy “way up here”.
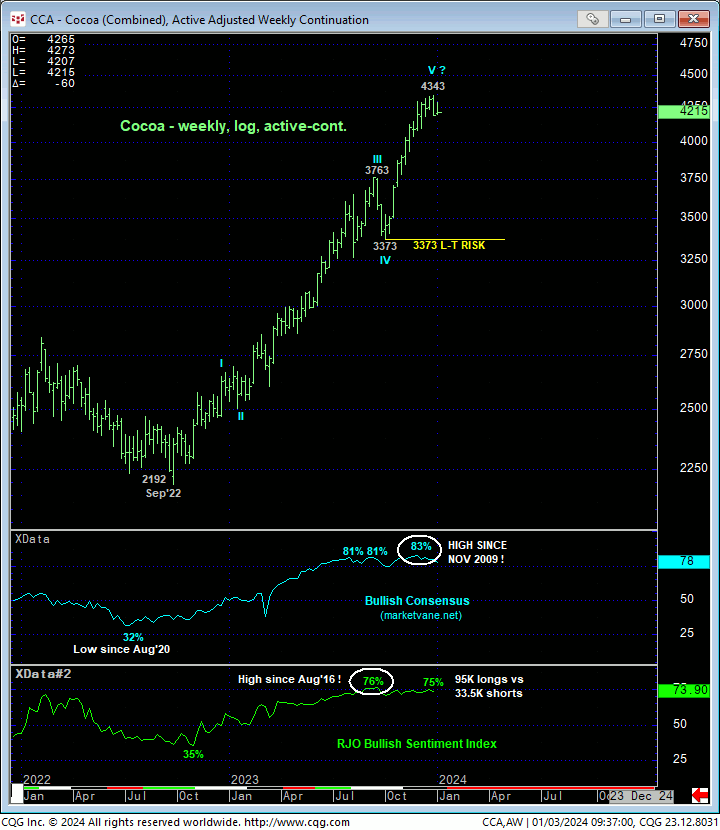
We specify this 3775-to-3429-area as pivotal from a long-term perspective because when we drill down to a weekly log scale perspective below, this chart shows a major corrective low at 3373 that the past 15-month portion of the secular bull would be expected to sustain gains above to maintain a more immediate bullish count. If the market fails below 3373, it will end what we believe is a textbook 5-wave Elliott sequence up from Sep’22’s 2192 high.
Also notable in the weekly chart are understandably historically extreme levels of market sentiment/contrary opinion, levels that are typical of major PEAK/reversal environments. Indeed, at a recent 76% reading, our RJO Bullish Sentiment Index posted its highest level since Aug’16. The recent 83% reading in the Bullish Consensus (marketvane.net) was the highest since Nov 2009! HOWEVER, traders are reminded that sentiment/contrary opinion is not an applicable technical tool in the absence of an accompanying confirmed bearish divergence in momentum of a scale sufficient to even threaten the secular bull. Herein lies the importance, especially “up here”, of the bull continuing to BEHAVE LIKE ONE by sustaining trendy, impulsive behavior higher.
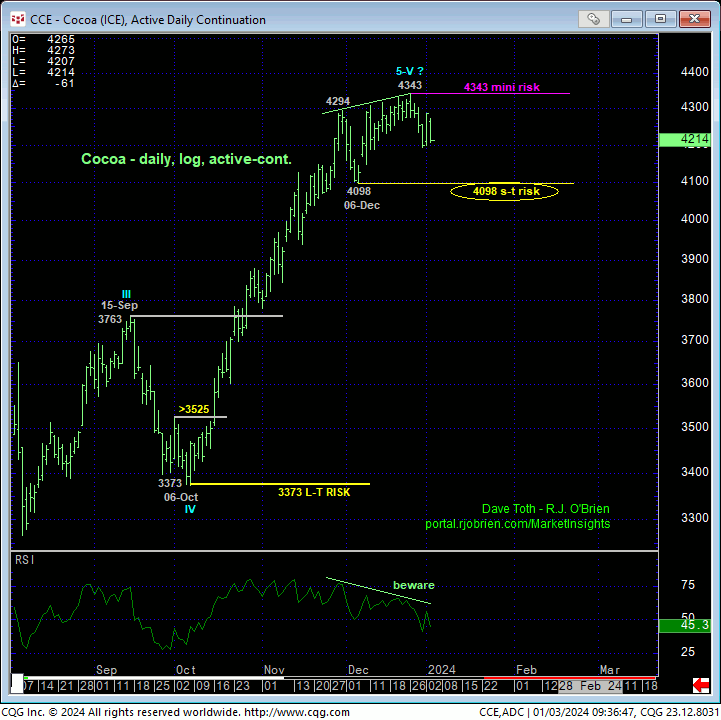
Drilling down further to a daily log scale view, the chart below shows upside momentum clearly waning over the past month. In our latest technical update, we identified 06-Dec’s 4098 low as the latest smaller-degree corrective low the market needs to sustain gains above to avoid confirming a divergence that would, in fact, break Oct-Dec’s uptrend, exposing at least a larger-degree correction of this portion of the secular bull. And given the extent and uninterrupted nature of Oct-Dec’s uptrend that left nothing in the way of former battlegrounds that might now be looked to as prospective support below 4098, the extent of the market corrective or reversal vulnerability below 4098 is indeterminable and potentially extreme. Per such, we’re identifying 4098 as our short-term but pivotal parameter from which both short- and longer-term traders can objectively base and manage the risk of a still-advised bullish policy and exposure.
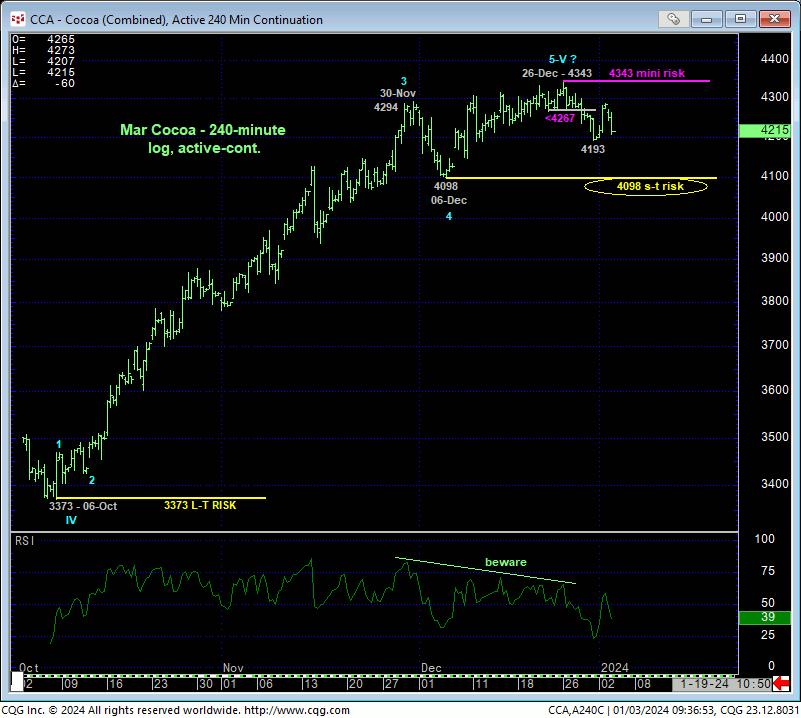
Lastly and on an intra-day basis, the 240-min chart below shows 28-Dec’s slip below a very, very minor corrective low at 4267 from 21-Novs that confirms a bearish divergence in hourly momentum. This mo failure defines 26-Dec’s 4343 high as one of developing importance and a mini parameter from which non-bullish decisions like long-covers and cautious bearish punts can be objectively based and managed.
Can we conclude a larger-degree correction or reversal from this minor mo failure? Of course not. But we CAN conclude last week’s 4343 high as an objective, market-define high that the market must now recoup to nullify ANY bearish count and reinstate the secular bull. And although this 240-min chart doesn’t show it, last week’s setback unfolded in a trendy, impulsive manner that was followed by a 61.8% retrace to yesterday’s 4287 high., typical underpinnings to the initial stages of a correction (lower) that’s got further to go and perhaps a more egregious move south until/unless negated by a recovery above 4343.
These issues considered, shorter-term traders are advised to move to a neutral/sideline stance or even a cautious bearish stance with a recovery above 4343 required to negate this call, warrant its cover and reinstate the secular bull. A bullish policy and exposure remain advised for intermediate-to-longer-term players with a failure below 4098 required to threaten the secular bull trend enough to warrant moving to a neutral/sideline position in order to circumvent the depths unknown of a correction or major reversal lower that could be major in scope. For a proxy as to what type of downside vulnerability this cocoa market may have if/when it fails below 4098, one need only look at the past couple months 28% meltdown in the sugar market following its momentum failure below 04-Oct’s 25.28 larger-degree corrective low.
