
As of Thursday, the September WTI crude oil contract is trading $56.40 per barrel, up 52 cents as yesterday’s EIA showed another large draw and the September crack spread grew stronger, moving to today’s highs. As the market weighs running at an oversupply that necessitates production cuts and quotas as well as tensions around the Strait of Hormuz and Iran.
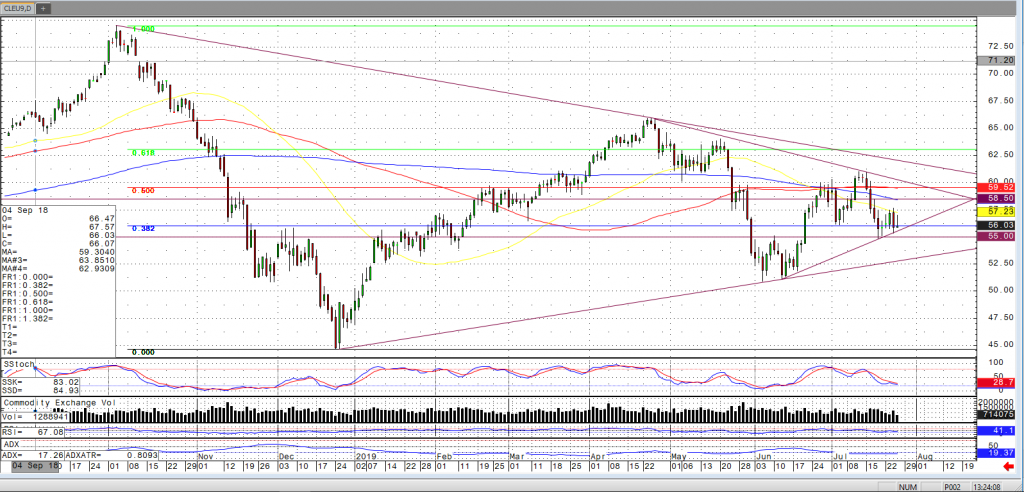
Looking to the charts and technical, it is interesting to not the levels marked by the Fibonacci retracement from the high to low move from late last year. In addition to the Fibonacci and moving average levels in the chart below, it may be of interest to note the trendlines and chart formations from the recent price action. I have recently looked at options at the strikes coinciding with the 58.50 and 55 levels below. Trading a breakout from such levels may be a strategy as it seems the market is coiling between the 38.2 and 50% retracement levels (referred to as the box by some) and a trend decision or trendline break potentially imminent.