
Posted on Feb 01, 2024, 08:47 by Dave Toth
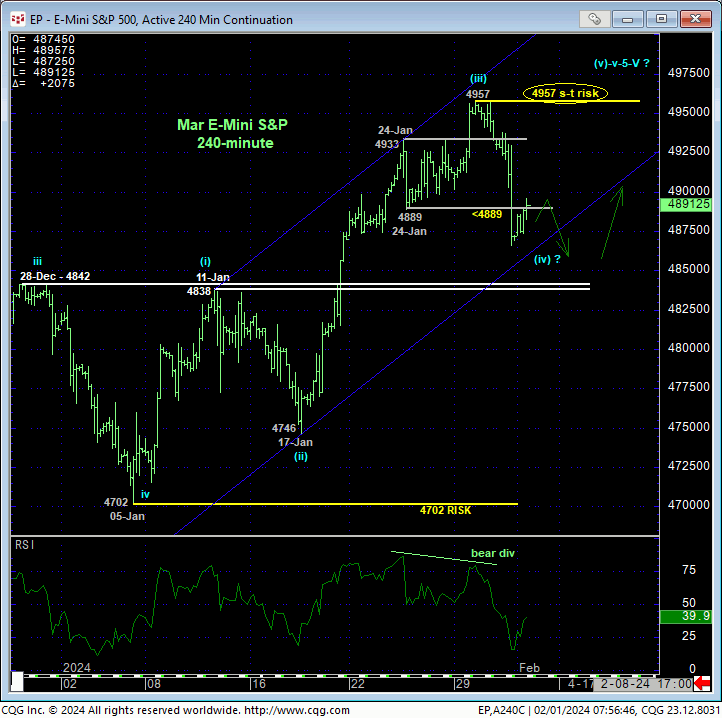
In Tue’s Technical Blog we identified 24-Jan’s 4889 low as the latest smaller-degree corrective low and short-term risk parameter the market needed to sustain gains above to maintain a more immediate bullish count following Mon’s surge to another new all-time high. The 240-min chart below shows the market’s failure below this level yesterday that confirms a bearish divergence in short-term momentum that breaks the uptrend from 17-Jan’s 4746 low. This short-term mo failure defines Tue’s 4957 high as one of developing importance from a shorter-term perspective and our new short-term parameter from which shorter-term traders can objectively base non-bullish decisions like long-covers and cautious bearish punts. This mo failure is INsufficient to conclude anything more than another interim corrective setback within the secular bull market where key former resistance around the 4842/4838-area would be expected to hold as new near-term support.
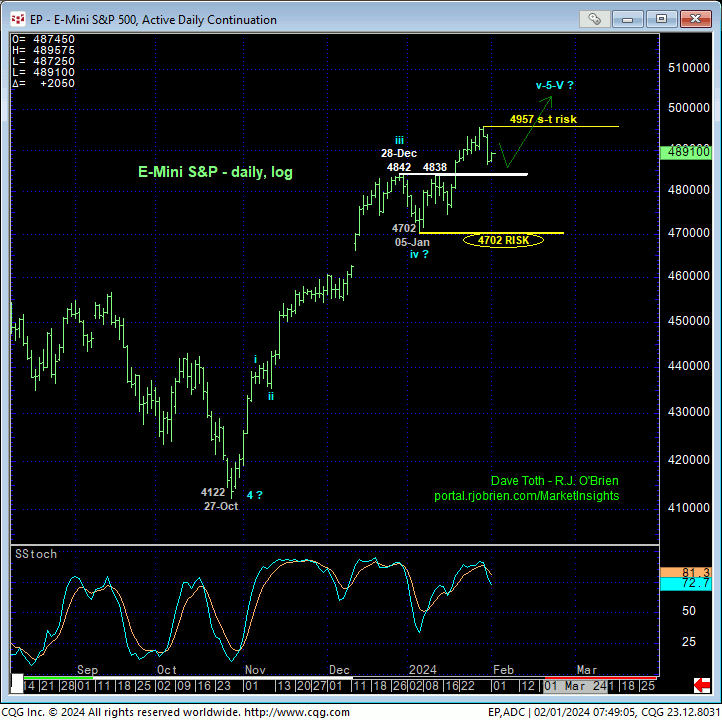
On a broader scale, the daily log chart above shows the significance of former 4842/4838-area resistance-t8urned-support and especially 05-Jan’s 4702 larger-degree corrective low. ESPECIALLY after breaking Jan’22’s 4808 previous all-time high, the longer-term bull would/should fully be able to sustain trendy, impulsive price action higher from 05-Jan’s 4702 larger-degree corrective low in order to maintain the risk/reward merits of a longer-term bullish policy and exposure “up here”. Per such, this 4702 level remains intact as a key parameter from which longer-term institutional players and investors can objectively base and manage the risk of a still advised bullish policy and exposure.
In effect, as a result of yesterday’s bearish divergence in short-term momentum, we have the not uncommon situation where the short-term trend is down within the longer-term uptrend, with the key directional flexion points heading forward at 4957 and 4702. As always, we nor anyone can objectively conclude a larger-degree peak/reversal threat from proof of just short-term weakness. This brings the key technical and trading matter of SCALE into the equation.
HOWEVER….you may want to keep a couple of very interesting longer-term considerations, discussed below, in the back of your bullish minds that warrant the market being able to sustain 1Q2024 gains above at least 4702 and especially pivotal former resistance-turned-support from the 4808-to-4635-area (Jan’22 and Jul’23 former resistance).
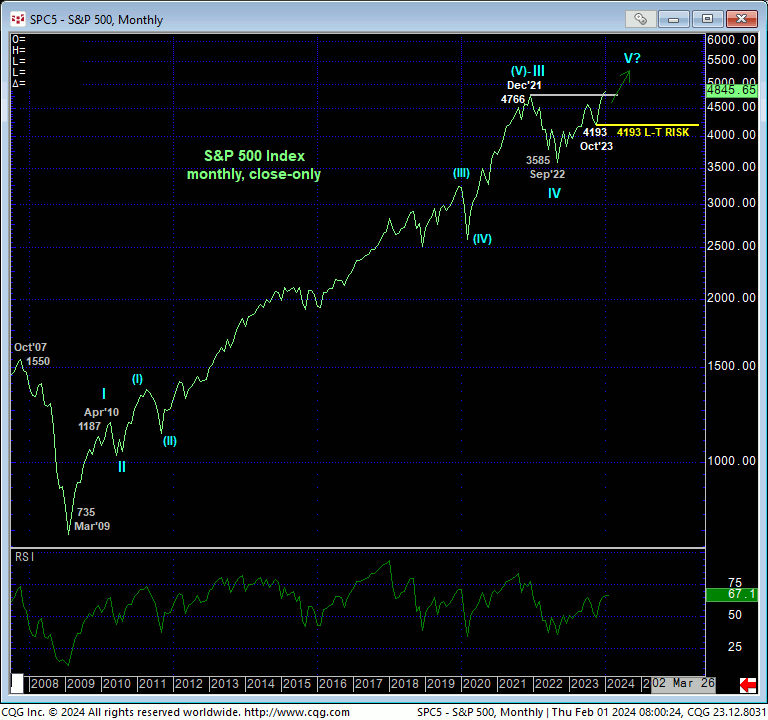
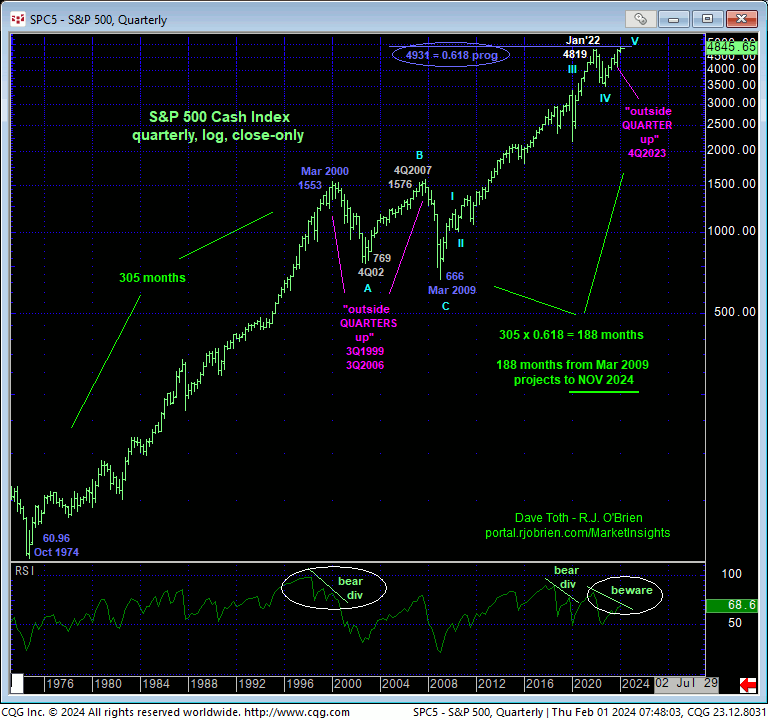
Moving out even further, the monthly log close-only chart of the underlying S&P 500 Index above shows the secular bull market from Mar 20009’s 735 low monthly close. By virtue of the past month’s break to a new all-time high, we can conclude Dec’21 – Sep’22’s “mere” 25% decline as a (probable 4th-Wave) correction. This acknowledgement then suggests the rally from Sep’22’s low is the prospective completing 5th-Wave of a massive Elliott sequence that dates from Mar 2009’s low as labeled. NOW HERE AGAIN, we cannot conclude the end of such a prospective 5th-Wave from proof of just minor weakness thus far. Indeed, even if Divine intervention confirmed to us that the rally from Sep’22 IS the completing 5th-Wave, on this scale this wave could continue for another 500- or 1,000-pts.
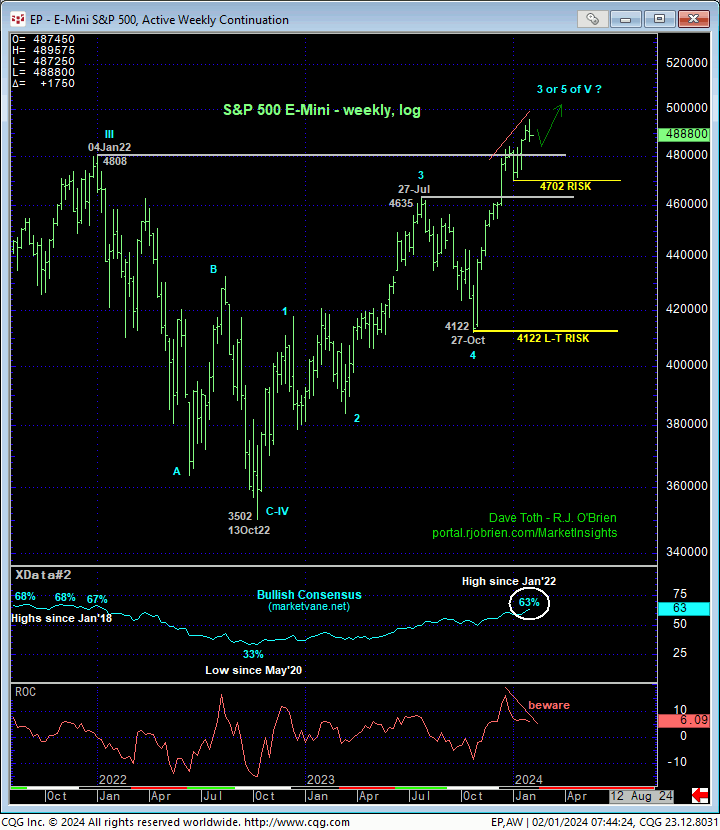
WHERE this market could continue to go is not the question as such is indeterminable. What IS determinable are the levels this continued bull should now be able to sustain gains above to remain intact. And as detailed above, we believe this “area” is the 4808-to-4635-range. IF/when this market ever fails below 4635, we believe the downside risk thereafter may make 2022s’ 25% swoon look like the hiccup it was.
To add intrigue to this 2024-year as a potentially pivotal one, we’d like to point out a couple facts in the quarterly log scale chart of the underlying S&P 500 Index below. A couple of weeks ago, we already pointed out that the 4Q23 produced as “outside quarter UP” (a lower low, higher high and higher close than 3Q23’s range and close). Typically understood to be a sign of strength, it is interesting to note that such “outside QUARTERS UP” preceded BOTH the 1Q2000 AND 4Q2007 massive tops.
This quarterly log chart also shows the Oct 1974-to-Mar 2000 previous 305-month secular bull trend from 60.96 to 1553. The 61.8% progression of this 25-year bull move taken from Mar 209’s 666 low projects to 4,931. Tue’s high in the S&P 500 Index was precisely 4,931!
The 61.8% progression of the 305-month rally from 1974 to 2000, taken from Mar 2009’s low coincidentally projects to NOV 2024! No, there’s not much going on this November, eh?
And there’s still the prospect that the massive rally from 2009 might be at the tail end of a textbook 5-wave Elliott sequence.
Long-term readers of our technical research know of our disdain for merely “derived” technical levels like tend lines, Bollinger Bands, the ever-useless moving averages and even the vaunted Fibonacci relationships we cite often in our analysis. NONE of any of these so-called “technical levels” mean a thing and are totally unreliable in the absence of an accompanying confirmed bearish (in this case) divergence in momentum. This gets us back to PROOF OF LONGER-TERMN WEAKNESS below 05-Jan’s 4702 larger-degree corrective low and then, subsequently, below last Jul’s 4635-area of resistance-turned-support. And especially if such weakness unfolds in 1Q24. Until/unless such larger-degree weakness is proven, smaller-degree weakness like that from yesterday’s bearish divergence in short-term momentum falls well within the bounds of a corrective buying opportunity for longer-term institutional traders and investors.
These issues considered, a bullish policy and exposure remain advised for longer-term players and investors with a failure below 4702 still required to move to a neutral/sideline position. Shorer-term traders have been advised to move to a neutral/sideline position to circumvent the depths unknown of an interim corrective setback with a recovery above 4957 required to reinstate the bull and warrant a resumed bullish stance. We will be watchful for a correction-countering bullish divergence in short-term mo from the 4840-area for a resumed and favorable risk/reward opportunity to return to the bull side.