Posted on Dec 28, 2023, 10:56 by Dave Toth
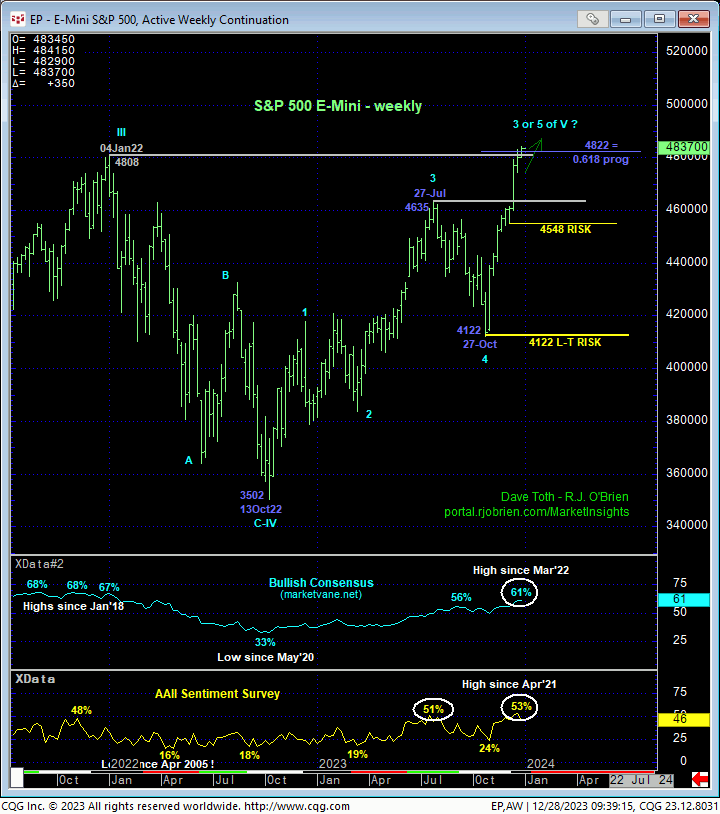
With 19-Dec’s break above 04Jan22’s 4808 high, the market has confirmed 2022’s 27% swoon as a correction and reinstated the secular bull trend. Boldly going where this market has never gone before, it has exposed a frontier where NO levels of any technical merit exist above it. In effect, there is no resistance. ALL technical levels of merit now only exist BELOW the market in the forms of former resistance-turned-support and, most importantly, recent corrective lows the bull is now required to sustain gains above to maintain a bullish count and policy.
Specifically, by breaking both 27-Jul’s 4635 key high and resistance AND Jan’22’s 4808 high and resistance, this now-former resistance between 4808-and-4635 would fully be expected to hold as new support per any broader continuation of the secular bull market. Also specifically and as we’ll detail in daily and intra-charts below, Dec’s continuation of the Oct-Dec rally leaves a key larger-degree corrective low in its wake at 4548 that it should must sustain gains above to maintain the impulsive integrity of a bullish count. Per such, this 4548 level serves as a key long-term parameter from which a bullish policy and exposure can be objectively based and managed.
Traders will also note in the weekly chart below the prospect that the rally from 27-Oct’s 4122 major corrective low may be the completing 5th-Wave of an Elliott sequence that dates from Oct’22’s 3502 low. This prospect means little until/unless this bull starts failing to sustain gains and confirms bearish divergences in momentum sooner rather than later in the new year. And herein lies the importance of corrective lows and specific parameters from which the risk of a bullish policy and exposure can be objectively based and managed.
Also notable in the weekly chart below is the understandable return to historically frothy levels of market sentiment/contrary opinion. Such levels are typical of broader PEAK/reversal-threat environments. HOWEVER, sentiment/contrary opinion is not an applicable technical tool in the absence of an accompanying CONFIRMED bearish divergence in momentum of a scale sufficient to threaten the major uptrend. This gets us back to the key technical tool of MOMENTUM and the corrective lows the uptrend leaves in its wake and is required to sustain gains above to remain an uptrend.


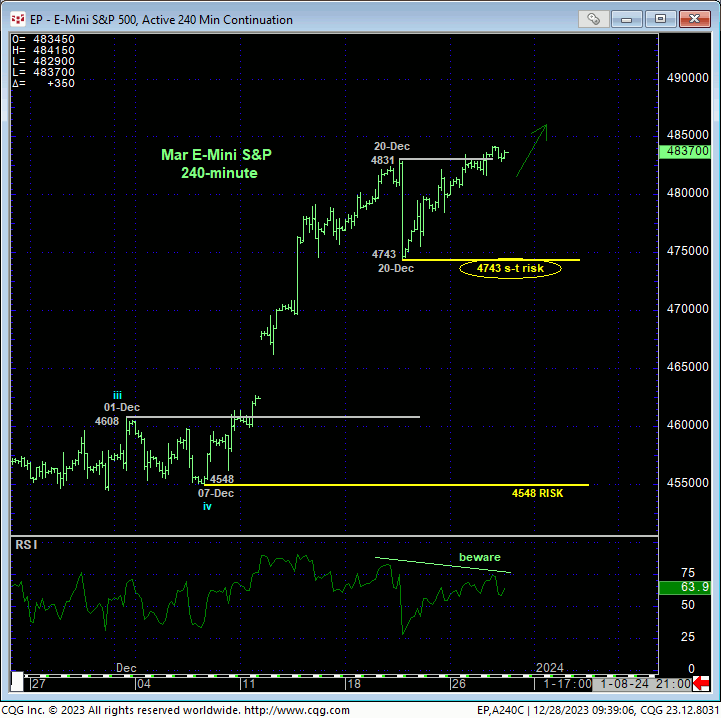
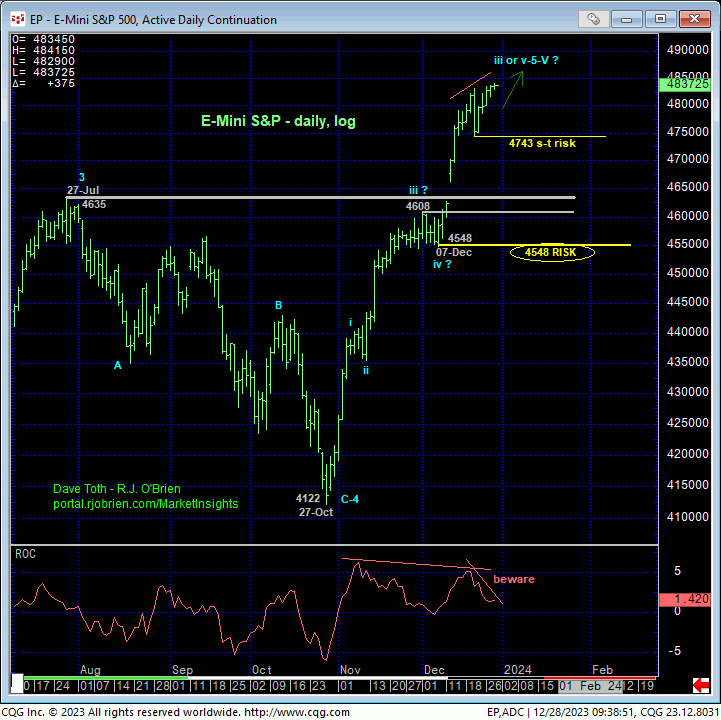
Drilling down to a smaller scale, the 240-min chart above and daily log chart below detail the impressive, impulsive uptrend from 27-Oct’s 4122 low following 02-Nov’s bullish divergence in momentum discussed in that day’s Technical Blog. As a result of this week’s break above last week’s 4831 high, the market has defined smaller- and larger-degree corrective lows at 4743 and 4548. A slip below 4743 will confirm a bearish divergence in very short-term momentum, allowing us to only conclude the end of the rally from 07-Dec’s 4548 larger-degree corrective low. If/when such sub-4743 weakness is proven, we’ll only be able to approach that setback as another correction within the secular bull. Such a smaller-degree mo failure would be of a grossly insufficient scale to conclude anything other than another interim corrective dip.
To more severely threaten the major bull and expose a larger-degree correction or reversal lower, commensurately larger-degree weakness below at least 07-Dec’s 4548 larger-degree corrective low and key longer-term bull risk parameter remains required. On such a sub-4548 failure, we will be able to CONCLUDE the end of the uptrend from 27-Oct’s 4122 low that could be the precursor to concluding the end to the 15-month uptrend from Oct’22’s 3502 low and another major peak/reversal threat.
In sum, after breaking Jan’22’s 4808 high, the market’s upside potential is as indeterminable and Captain Kirk’s final frontier. The bull can continue from this point indeterminately. And in this regard, the bull would be expected to BEHGAVE LIKE ONE by sustaining trendy, impulsive behavior higher. On this trek, it should NOT be able to fail below larger-degree corrective lows like 4548 and especially 27-Oct’s major corrective low at 4122. These levels- 4743, 4558 and 4122- define the specific bull risk parameters/exit strategies heading into 2024 from which short- and longer-term traders and investors can objectively rebase and manage the risk of bullish policies and exposure. These flexion points and rationale may come in handy when considering some really long-term metrics discussed below.

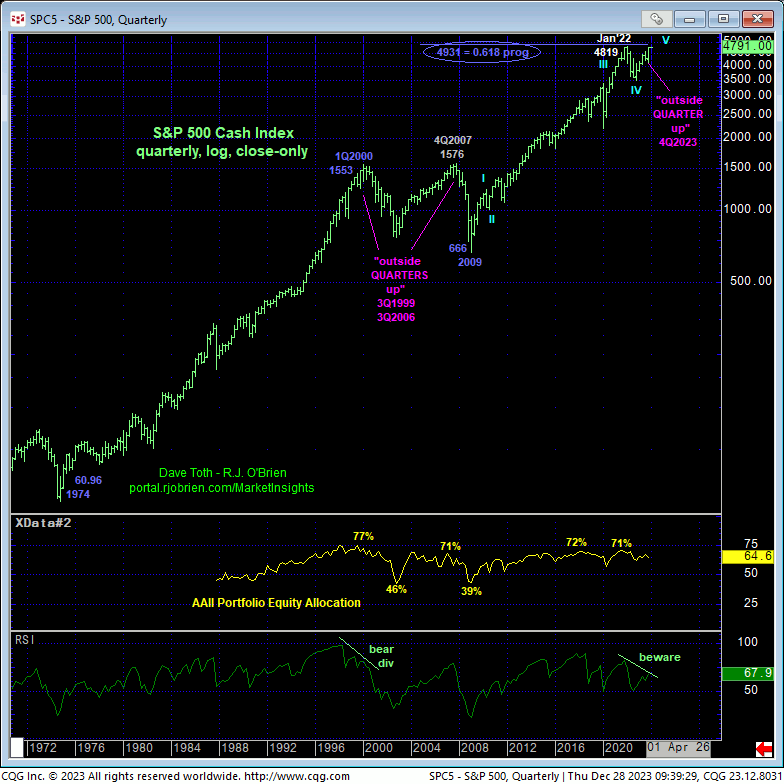
The quarterly log scale chart below is of the underlying S&P 500 Index. It has yet to eclipse Jan’22’s 4819 all-time high, but we suspect this is a technicality that will soon be resolved. Threats to the secular bull market exist from:
- waning multi-quarter upside momentum and the POTENTIAL for a bearish divergence in momentum similar to that that warned of and accompanied 1Q2000’s major top
- historically frothy sentiment levels (i.e. portfolio equity allocation as reported by the American Association of Individual Investors, AAII)
- the prospect that the rally from Oct’22’s 3502 low is the completing 5th-Wave of a massive sequence from 2009’s 666 low
- the Fibonacci progression fact that the market is closing in on the (4931) 0.618 progression of 1974-to-2000’s rally from 60.96 to 1553 taken from 2009’s 666 low.
It may also prove notable that, today, the Index is closing out an “outside QUARTER up” (higher high, lower low and higher close than 3Q23’s range and close). By most accounts, this would be considered a sign of extraordinary STRENGTH. And we’re going to approach it as such. However, we find it very interesting that such “outside QUARTERS up” occurred in the preceding quarters to BOTH 4Q2007’s major top and reversal AND 1Q2000’s major top and reversal.
None of these peak/reversal-threat elements mean a thing until/unless the market breaks the simple but major uptrend pattern of higher highs and higher lows. And we’ve identified, specifically, the pertinent levels and risk parameters for all scales from which to continue to gauge the major bull trend and manage the risk of a bullish policy. This bull may continue unabated for another year. Or it could top out in Jan like it did two years ago. The key is acknowledging and adhering to specific bull risk parameters and exit strategy levels like 4743 for short-term traders and 4548 and/or 4122 for longer-term players and investors. Until/unless these levels are broken, further, indeterminable gains are expected. If/when these levels are broken, shorter-term traders and then longer-term players and investors should take heed in order to circumvent the risks and loss of Jan-Oct’22, or worse.


