Posted on Jan 30, 2024, 09:23 by Dave Toth
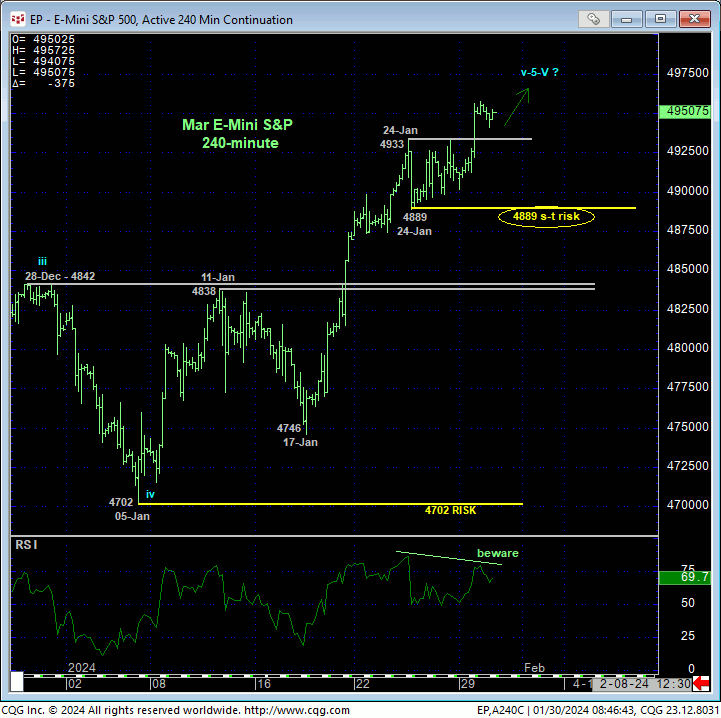
Yesterday’s break above last week’s 4933 high reaffirms the secular bull market with the important by-product being the market’s definition of 24-Jan’s 4889 low as the latest smaller-degree corrective low and level this market is now required to sustain gains above to maintain a more immediate bullish count. Its failure to do so will confirm a bearish divergence in short-term momentum, break the uptrend from at least 17-Jan’s 4746 low and expose a corrective setback that then could easily expose a return to key former resistance-turned-support around the 4840-area. Until/unless such sub-4889 weakness is proven, the trend is up on all scales and should not surprise by its continuance or acceleration straight away. Per such, we’re identifying 4889 as our new short-term parameter from which the risk of a still-advised bullish policy and exposure can be objectively rebased and managed by shorter-term traders with tighter risk profiles.

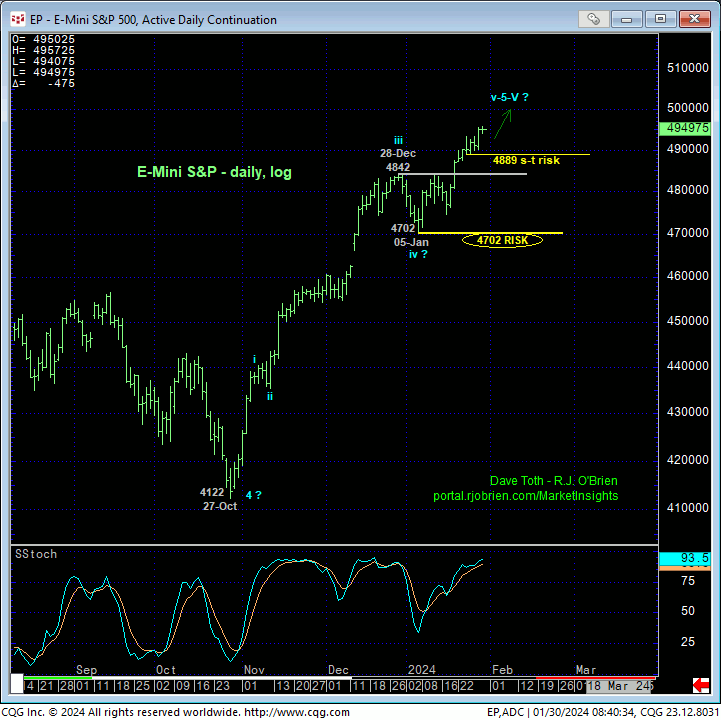
Moving back a notch, the daily log chart below shows this month’s continuation of the secular bull trend that requires a failure below 05-Jan’s 4702 larger-degree corrective low to break the uptrend from 27-Oct’s 4122 low and expose a major correction or reversal lower. Until/unless such sub-4702 weakness is proven, the secular bull market remain intact and should not surprise by its continuance. Per such, this 4702 level remains intact as our key long-term bull risk parameter pertinent to longer-term institutional traders and investors.


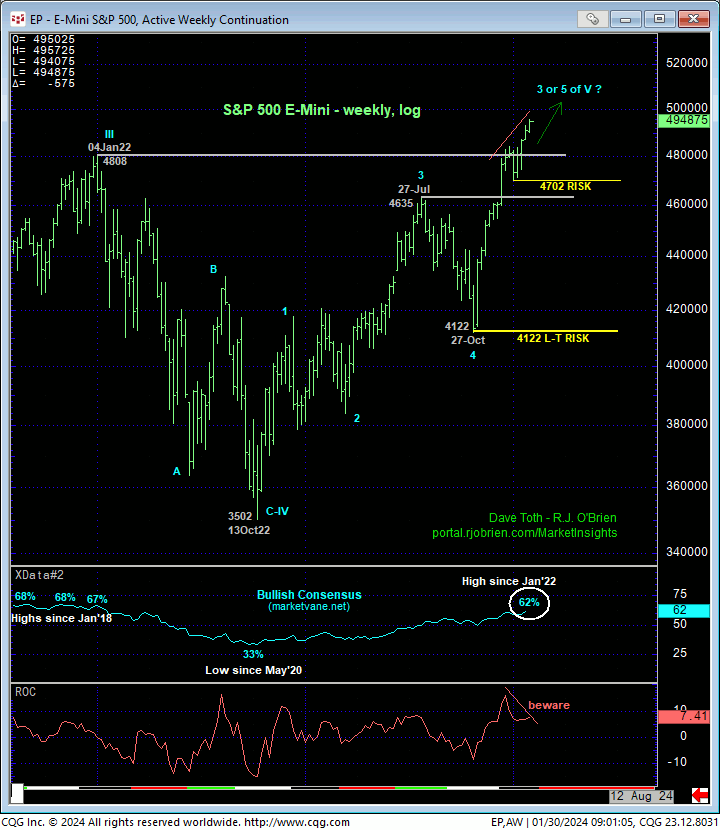
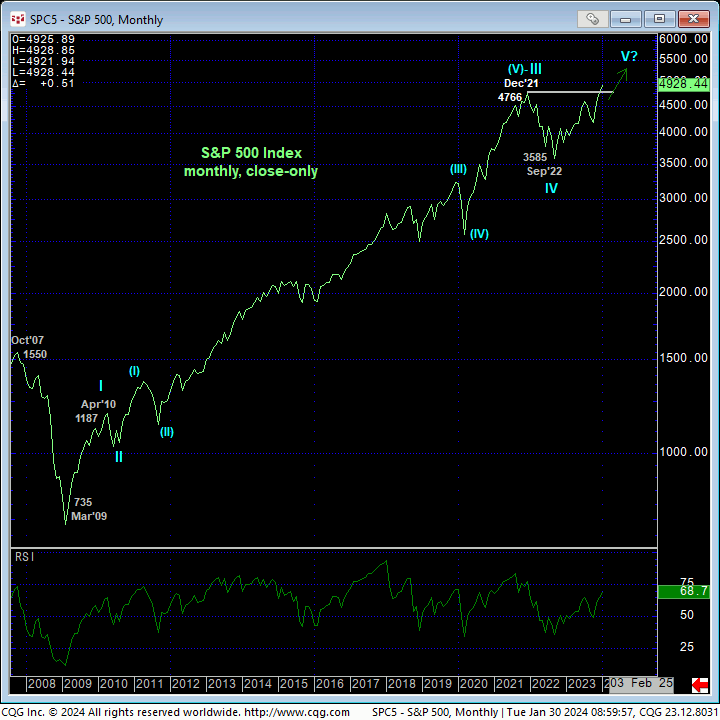
On an even longer-term basis, the weekly log chart of the contract above and monthly log close-only chart of the underlying S&P 500 Index below show the resumption of a secular bull market that dates from Mar’09’s low and end of a corrective/consolidative event that began in 2000. Subjectively, this nearly-15-YEAR bull move is arguably getting pretty long in the proverbial tooth as historical moves go and is arguably in the completing 5th-Wave of a massive Elliott sequence from that 2009 low.
HOWEVER, NONE OF THIS MATTERS until/unless the market starts breaking the simple but major uptrend pattern of higher highs and higher lows, starting with smaller-degree failures below corrective lows like 4702 that then morph into larger-degree momentum failures below a level like last Oct’s 4122 low. IF/when this market ever sees levels below 4122, especially after establishing new all-time highs, buckle-up for indeterminable nasty to the downside. UNTIL such larger-degree weakness is proven, the market’s remaining upside potential is also indeterminable and potentially extreme.
These issues considered, a full and aggressive bullish policy and exposure remain advised with a failure below 4889 sufficient for shorter-term traders to move to a neutral/sideline position and commensurately larger-degree weakness below 4702 for longer-term institutional players and investors to follow suit. In lieu of such weakness, further and possibly accelerated gains straight away remain expected.


