Posted on Oct 25, 2023, 07:51 by Dave Toth
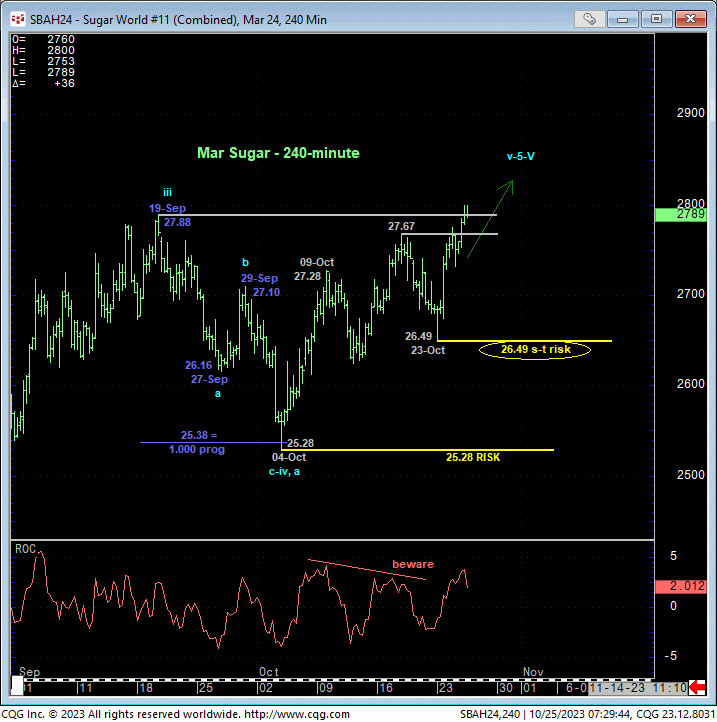
Overnight’s break above 19-Sep’s 27.88 high confirms our bullish count resurrected in 04-Oct’s Technical Blog and leaves Mon’s 26.49 low in its wake as the latest smaller-degree corrective low this market is now minimally required to fail below to warn of a peak/reversal threat. Per such, this 26.49 intra-day level serves as our new short-term parameter from which shorter-term traders with tighter risk profiles can objectively rebase and manage the risk of a still-advised bullish policy and exposure.
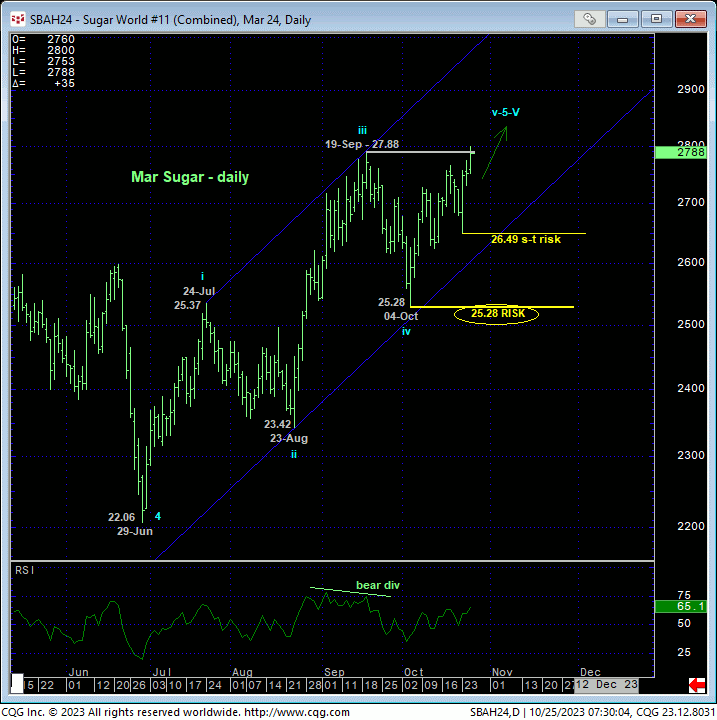
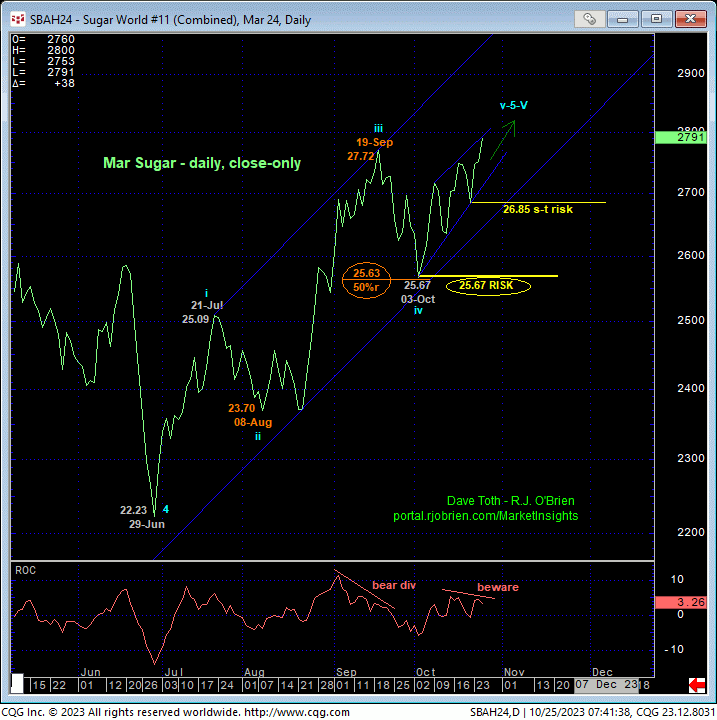
The daily bar chart above and close-only chart below show today’s continuation of the secular bull market that dates from Apr’20’s 9.21 low. On a broader scale, 04-Oct’s 25.28 intra-day low and/or 03-Oct’s 25.67 low close serve as our key long-term bull risk parameters. These are the levels this market MUST stay above to maintain a long-term bullish count pertinent to longer-term commercial players. A failure below these early-Oct lows WILL expose a peak/reversal threat that could be massive in scope potentially reversing the entire 3-1/2-YEAR bull trend.
We included the close-only chart below because it shows the developing POTENTIAL for a bearish divergence in momentum. This signal will be CONFIRMED to the point of non-bullish action like long-covers if it cannot sustain gains above last Fri’s 26.85 corrective low close. This close-only perspective also shows the prospect that the rally from 03-Oct’s 25.67 low close MIGHT be a 5th-Wave completing diagonal triangle. We don’t have to concern ourselves with this peak/correction/reversal threat until/unless this market fails below 26.85. But this factor warrants awareness.
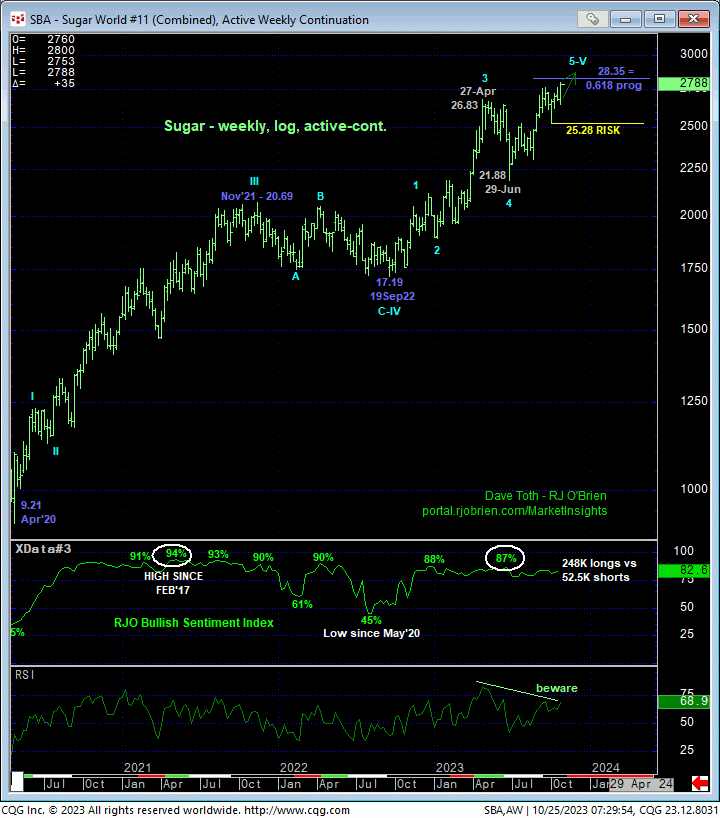
On a much longer-term basis, the weekly log chart (above) shows the continuation of the secular bull market from Apr’20’s 9.21 low. Might the rally from Sep’22’s 17.19 low be the completing 5th-Wave of a massive 5-wave Elliott sequence from the Apr’20 low? YES, absolutely. HOWEVER, since the trend is up on al scales, it is expected to continue and perhaps accelerate straight away with proof of weakness below the specific corrective lows and risk parameters discussed above required to defer and then threaten a bullish count to the point of defensive measures.
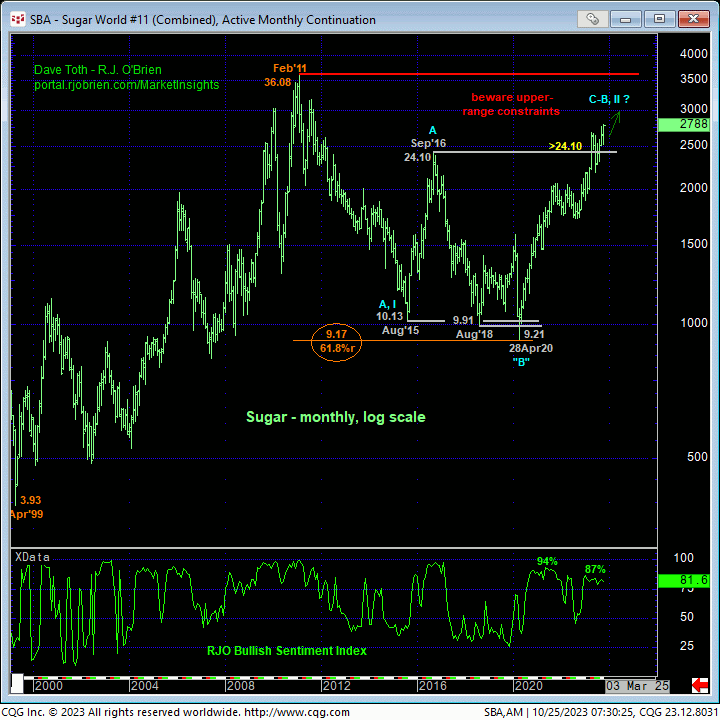
This long-term wave count combined with understandably historically frothy bullish sentiment, waning upside momentum and the market’s encroachment on the extreme upper recesses of this market’s 12-YEAR historical range shown in the monthly log chart below provide plenty of technical elements that warn of a peak/reversal-threat environment that would be major in scope. But until/unless this market breaks the clear and present uptrend below the corrective lows and risk parameters identified above, further and potentially sharp gains remain expected.
In sum, a bullish policy and exposure remain advised with a failure below 26.49 required for shorter-term traders to move to the sidelines and commensurately larger-degree weakness below 25.28 required for longer-term commercial players to follow suit.
