Posted on Nov 13, 2023, 08:50 by Dave Toth
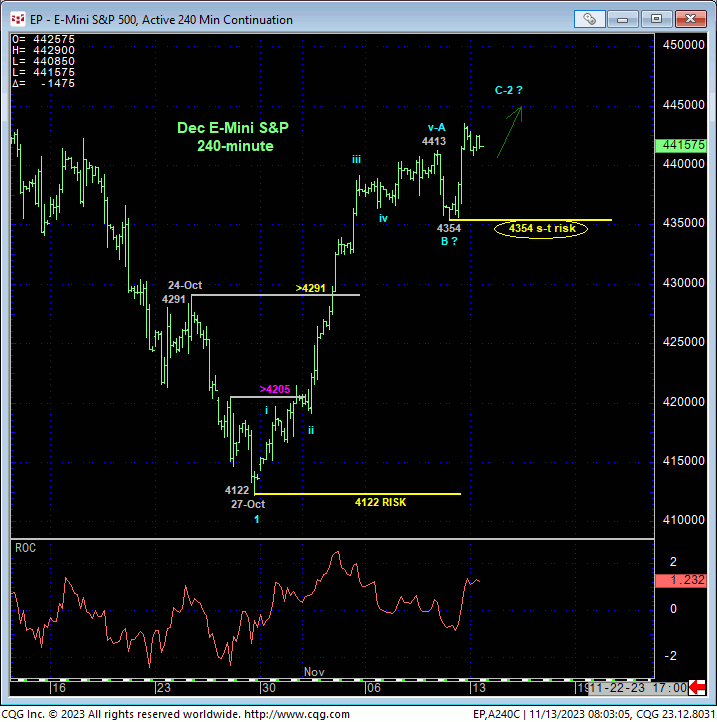
The 240-min chart below shows Fri’s continued impressive recovery from 27-Oct’s 4122 low above Thur’s 4413 high that leaves Fri’s 4354 low in its wake as the latest smaller-degree corrective low this market is now required to sustain gains above in order to maintain a more immediate bullish count “up here”. Its failure to do so will confirm a bearish divergence in short-term momentum and break this uptrend, exposing at least a steeper correction of the entire recovery from 4122 and possibly the dramatic 3rd-Wave decline within the still-arguable and major peak/reversal-threat process from 27-Jul’s 4635 high. Per such, we’re identifying 4354 as our new short-term but key bull risk parameter around which to base non-bullish decisions like long-covers and cautious bearish punts.
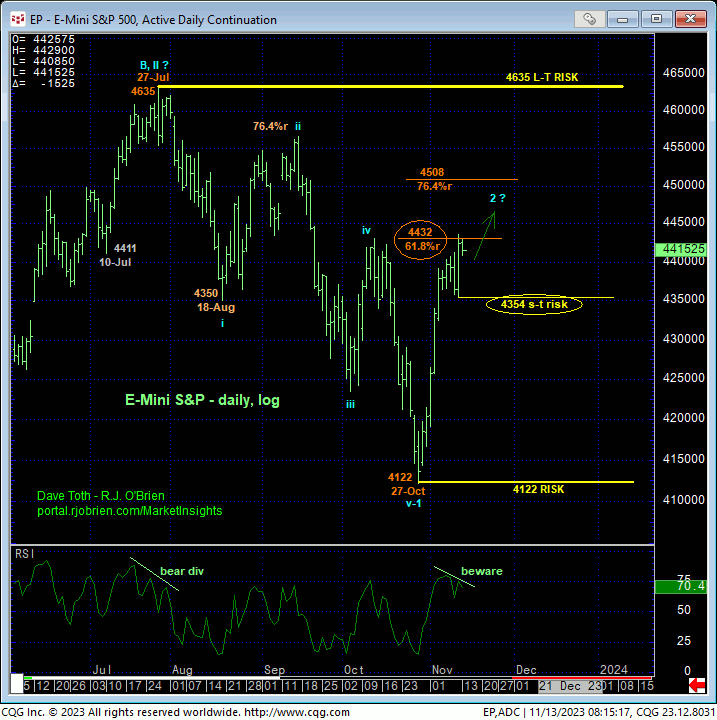
What could prove critical about an admittedly smaller-degree momentum failure below 4354 is the Fibonacci fact that the market has now retraced 61.8% of Jul-Ot’s 4635 – 4122 decline on a log scale. Perhaps this suspected 2nd-Wave will correct further to the (4508) 76.4% retrace of Jul-Oct’s decline similar to Aug-Sep’s corrective rebuttal to Jul-Aug’s initial counter-trend decline.
What we’re watching for here is the market’s failure to sustain the simple uptrend pattern of higher highs and higher lows at a level south of 27-Jul’s obviously key 4635 high. IF our entire peak/reversal count is totally wrong, and 27-Oct’s 4122 low completed a correction within a secular bull market, then this market would be expected to sustain trendy, impulsive behavior to the upside., ultimately needing to take out Jul’s 4635 high to negate a bearish count and confirm a long-term bullish count.
As always, we will NOT be able to conclude a resumption of a major peak/reversal count from proof of only short-term weakness below a level like 4354. HOWEVER, traders and investors must put/keep the past couple weeks’ recovery within the context of not only the past 3-1/2-months’ price action from 27-Jul’s 4635 high, but also the past 22-month price action from Jan’22’s 4808 all-time high. For until/unless this market BEHAVES LIKE A BULL by sustaining trendy, impulsive behavior higher and blows away those major highs and resistance, recovery attempts like the past couple weeks fall well within the bounds of corrective selling opportunities just as soon as the market breaks this uptrend with a countering bearish divergence in momentum. Herein lies the importance of even a smaller-degree corrective low and bull risk parameter like 4354.
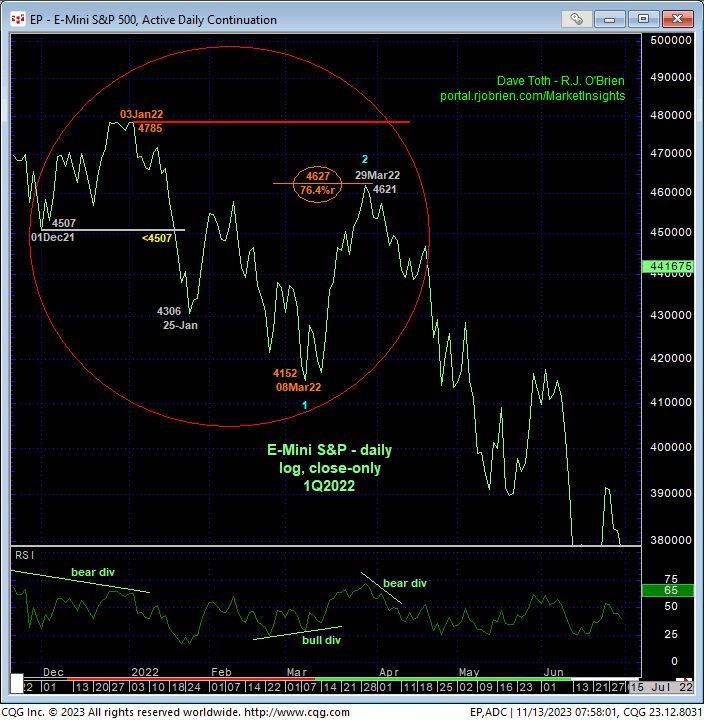
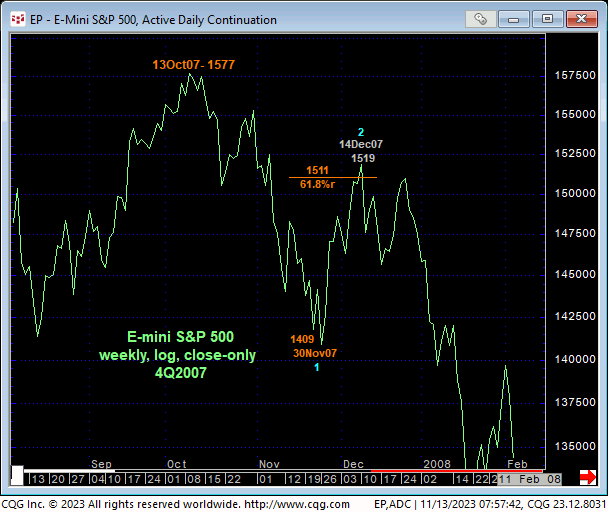
Indeed and as referenced in one of our recent updates, the daily log close-only chart above shows Mar’22’ whopping 76.4% retrace of Jan-Mar’22’s initial counter-trend plunge WITHIN that major peak/reversal PROCESS. Similarly, the weekly log close-only chart below shows Nov-Dec 2007’s more than 61.8% retrace of Oct-Nov’07’s initial counter-trend decline withing that major peak/reversal process. In both cases, smaller-degree bearish divergences in momentum led to larger-degree proof of weakness below these processes’ initial counter-trend lows that confirmed new major bear markets.
Again, we will not be able to CONCLUDE a resumption of Jul-Oct’23’s downtrend to new lows below 4122 from just a short-term momentum failure below 4354. However, the extent and uninterrupted nature of the past couple weeks’ impressive rally left NOTHING in the way of former battlegrounds below 4354 that we can look to as the next objective technical level for support shy of 27-Oct’s 4122 low. In other words, if bulls do not take defensive measures on a failure below 4354, there only remaining objective level below 4354 to do so is 4122.
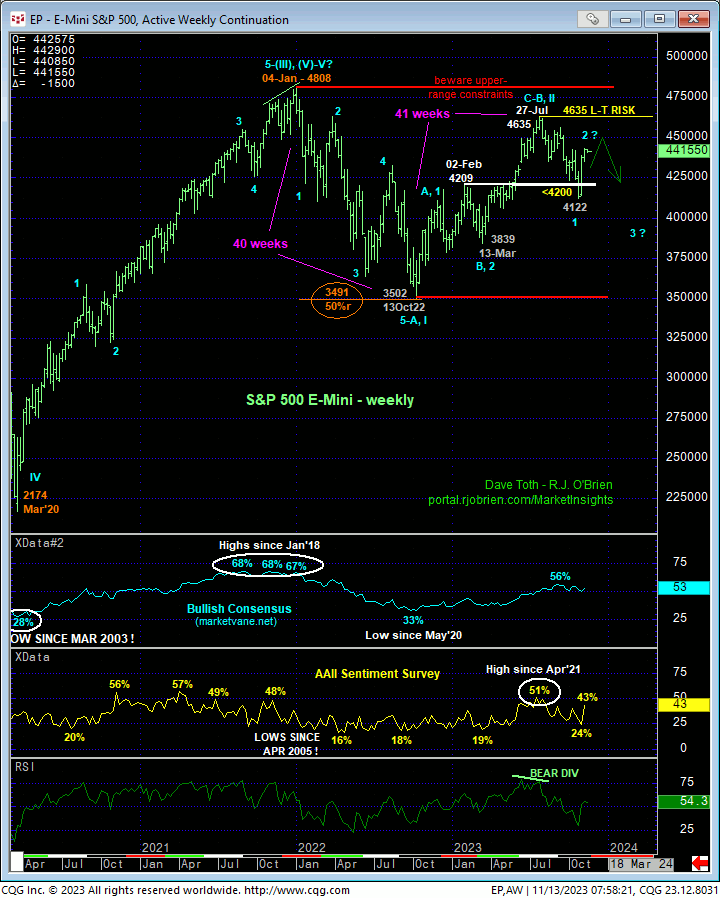
Stepping bac to consider this market’s longer-term price action, the weekly chart below shows this market’s position near the upper-quarter of the past 22-month range. We know for a fact that there are only three types of markets:
- trending
- consolidating within the trend
- reversing.
EVERY technical analysis theory (Elliott, Dow, candles, Market profile, etc.) has different terminology, of course, but they all reference where any market on any scale is within one of these three states.
This said, it is crystal clear that, since 1Q22, the major bull trend has been broken, so the price action from Jan’22’s 4808 can only be one of two things: a corrective/consolidative event ahead of the eventual resumption of the secular bull market OR a major reversal lower. To reinforce or re-expose the former bullish count, this market, minimally, needs to recoup 27-Jul’s 4635 high and preferably Jan’22’s 4808 high. To reinforce or re-expose a major reversal lower, this market needs to relapse below at least 27-Oct’s 4122 low. But for the shorter-term reasons cited above, a failure below Fri’s 4354 low is urged to be scrutinized closely for what could be sharp fallout thereafter.
These issues considered, an interim cautious neutral-to-bullish stance remains OK as long as the market sustains gains above 4354. A failure below 4354 will flip the directional script and, we believe, offer a potentially very favorable risk/reward opportunity from the bear side on corrective recovery attempts thereafter. Please stay tuned for future updates as this is getting very interesting and opportunistic “up here” in the weeks and days ahead.
