Posted on Dec 01, 2023, 06:17 by Dave Toth
JAN CRUDE OIL
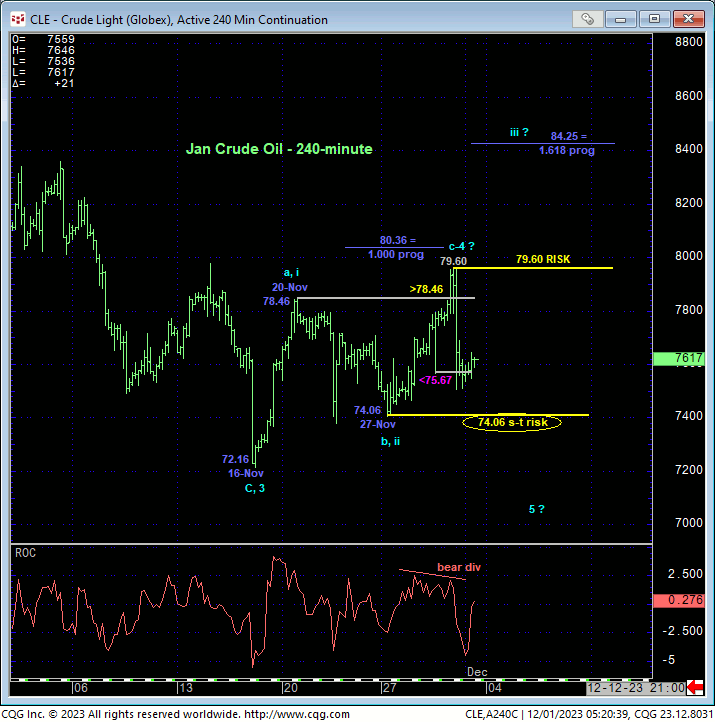
In Tue’s Technical Webcast we discussed some smaller-degree price action that warned of a correction or reversal above 20-Nov’s 78.46 high that would confirm a bullish divergence in daily momentum. The 240-min chart below shows the market’s break above that 78.46 high, giving the bull every opportunity to “perform” in a more protracted correction or reversal higher. Rather, this chart also shows the market’s gross failure to do so and confirming a countering bearish divergence in short-term momentum below a minor corrective low at 75.67 from Wed, defining yesterday’s 79.60 high as one of developing importance and possibly the end of a textbook 3-wave and thus corrective rebound from 16-Nov’s 72.16 low that warns of a resumption of Sep-Nov’s downtrend that preceded it.
Now, a relapse below Mon’s 74.06 low remains required to confirm the recent recovery as a 3-wave correction and re-expose the bear, so to that end that 74.06 level remains intact as our short-term parameter from which non-bearish decisions like short-covers and bullish punts can be objectively based and managed. But as a result of yesterday’s relapse, the market must now also prove strength above 79.60 to resurrect a larger-degree correction or reversal higher. In effect, we believe this market has identified 79.60 and 74.06 as the key flexion points around which to toggle directional biases and exposure commensurate with one’s personal risk profile.
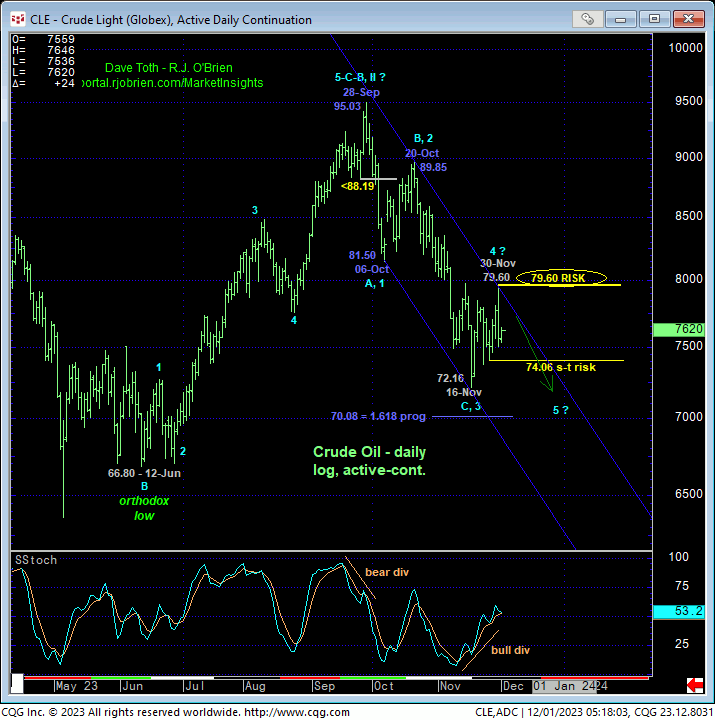
Stepping back, the daily log chart below shows the recent recovery attempt from 16-Nov’s 72.16 low falling well within the bounds of a (suspected 4th-Wave) correction within an eventual 5-wave sequence down to at least one more round of new lows below 72.16. A relapse below 74.06 will reinforce this count while a recovery above 79.60 will raise the odds that that 72.16 low might have completed only a 3-wave and thus corrective decline from 28-Sep’s 95.03 high and expose a more protracted correction or reversal higher, hence the importance of these two thresholds as key directional flexion points.
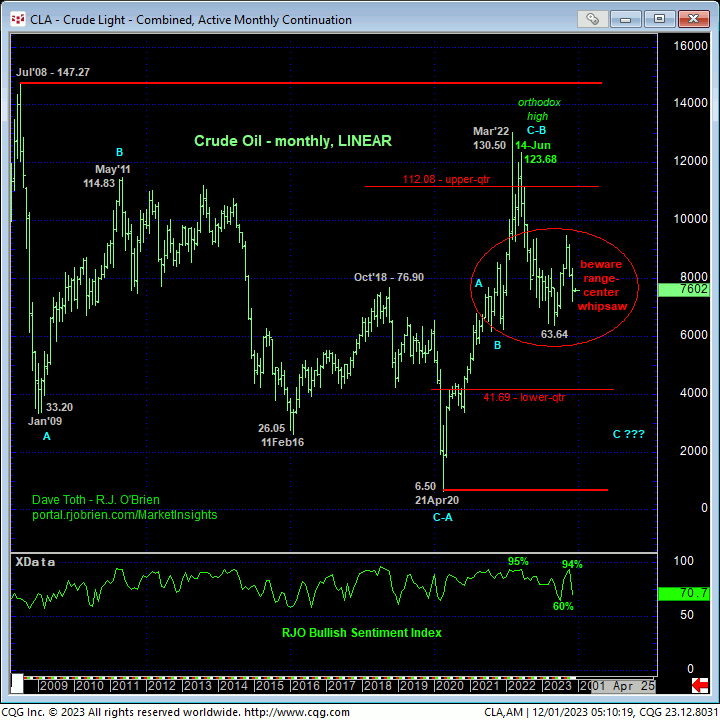
Stepping back even further, the weekly chart above shows the return to a relatively low 66% reading in our RJO Bullish Sentiment Index that cannot be ignored as an element that would contribute to a more protracted recovery. Additionally, this weekly chart shows the market’s position still within the middle-half bowels of this year’s range that remains a subset of the middle-half bowels of this market’s massive but lateral historical range shown in the monthly chart below. Such a “ranges within ranges” environment raises the odds of aimless whipsaw risk that warrants a more conservative approach to directional risk assumption. And herein lies the importance of tightening directional flexion points and risk parameters to 79.60 and 74.06.
These issues considered, a bearish policy and exposure remain advised for longer-term commercial players with a recovery above 79.60 required to move to a neutral-to-cautiously-bullish stance ahead of a potential more protracted, if intra-range recovery. Shorter-term traders with tighter risk profiles remain OK to maintain a neutral-to-cautiously-bullish stance with a failure below 74.06 negating this call and warranting its cover.
JAN HEATING OIL
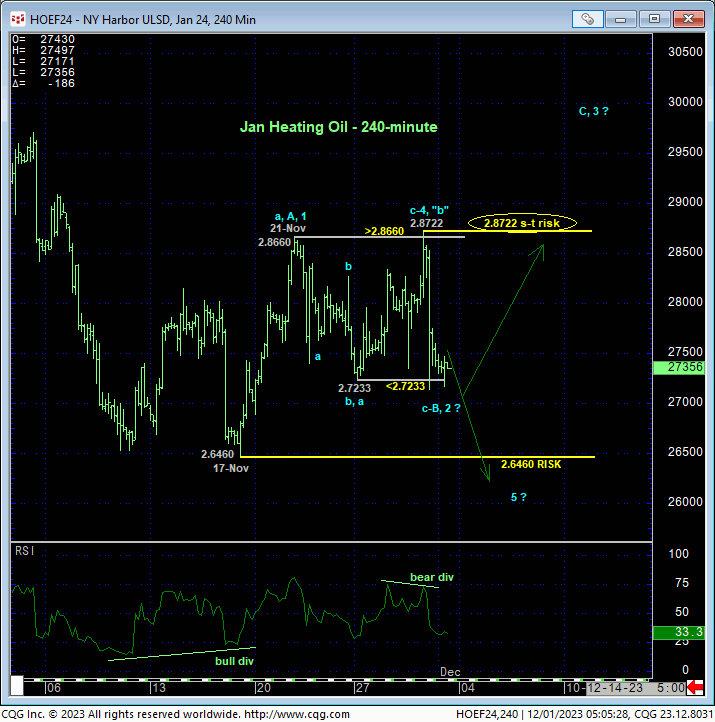
Similarly, after taking out 21-Nov’s 2.8660 high, yesterday’s miserable failure to sustain that breakout and subsequent relapse below Mon’s resulting 2.7233 corrective low confirms a countering bearish divergence in momentum to the bullish divergence in daily momentum we’ll discuss below. As 17-Nov’s 2.6460 low remains intact however and since this week’s rally attempt looks to be only a 3-wave affair, it’s possible that this week’s pop was the “b”-Wave of an “irregular” correction that started from 21-Nov’s 2.8660 high and may be ending with yesterday’s relapse as the completing c-Wave. If correct, this count warns of even further volatility as it would suggest a sharp, impulsive resumption of mid-Nov’s initial A- or 1st-Wave to levels above yesterday’s 2.8722 high.
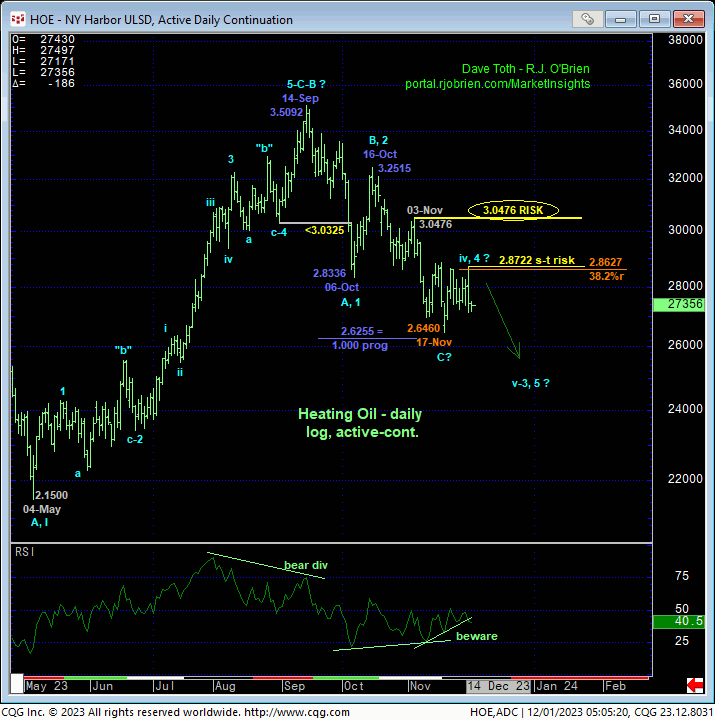
Per such a bullish prospect however, the market still needs to arrest yesterday’s miserable relapse with a countering bullish divergence in short-term mo from a level above 2.6460. We will keep a keen eye out for such in the days and perhaps hours immediately ahead. Until/unless this condition is met, the mid-to-late-recovery attempt is thus far clearly only a 3-wave affair that, until mitigated by a recovery above 2.8722, may be considered a corrective/consolidative event that warns of a resumption of Sep-Nov’s downtrend that preceded it.
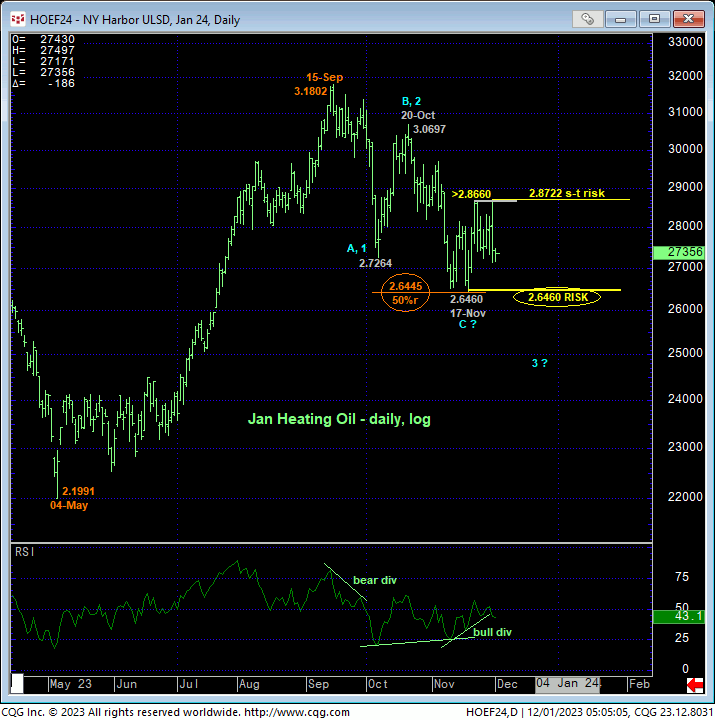
On a broader basis, the daily log scale chart of the Jan contract shows a textbook 3-wave decline THUS FAR from 15-Sep’s 3.1802 high that has thus far held the exact 50% retracement of May-Sep’s major rally from 2.1991 to 3.1802. Left unaltered by a relapse below 2.6460, this 3-wave decline may be considered a correction that warns of a resumption of the uptrend that preceded it. A recovery above yesterday’s 2.8722 high is now minimally required to mitigate a bearish count and reinforce such a bullish prospect.
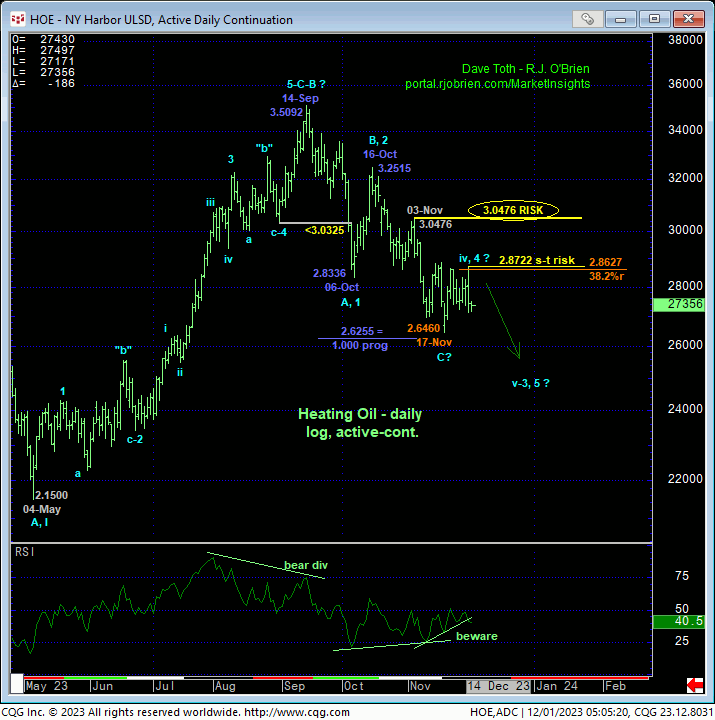
On an active-continuation basis below however, Nov’s thus-far mere lateral chop still arguably falls well within the bounds of “just” a corrective/consolidative event that would warn of a resumption of Sep-Nov’s downtrend. It’s easy to see the developing importance of yesterday’s 2.8722 high needed to threaten such a bearish count and reinforce a base/correction/recovery count.
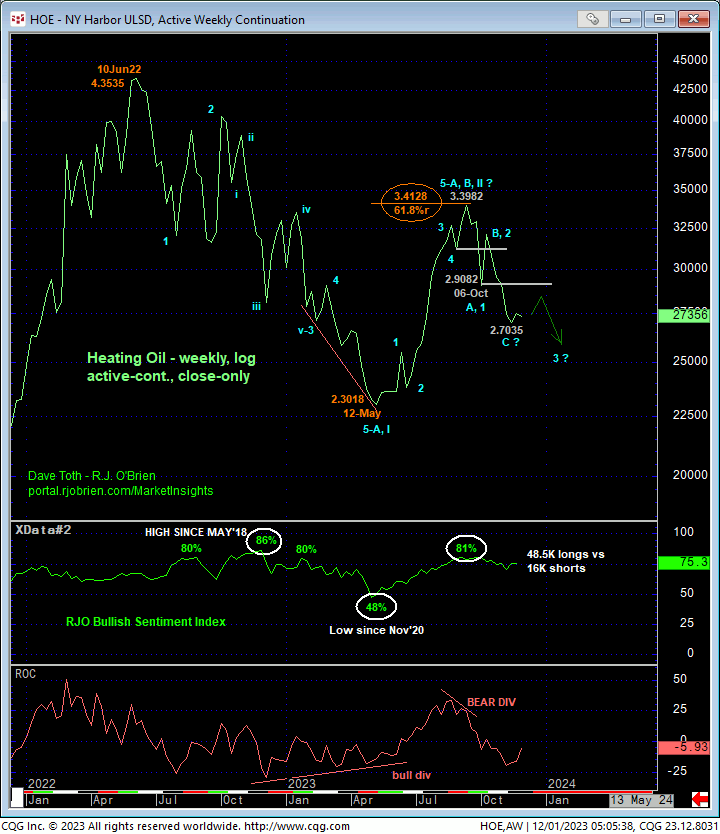
Moving out even further to a weekly log close-only perspective of the most active futures contract, the chart below shows a clear downtrend that has yet to exhibit enough strength to suggest a more significant bottom. Additionally, and UNlike crude oil, our TRJO Bullish Sentiment Index of the hot Managed Money positions reportable to the CFTC remains at a relatively frothy level of 75%, reflecting 48K longs to just 16K shorts. This element would seem to be more consistent with a still arguable broader move south.
These issues considered, traders are urged to acknowledge and be flexible to a bigger move EITHER WAY with the key directional flexion points being yesterday’s 2.8722 high and 17-Nov’s 2.6460 low. While these levels represent obvious flexion points around which to toggle directional biases and exposure, a neutral/sideline policy is advised for the time being. A Thur-relapse-countering bullish divergence in short-term momentum from a level between spot and 2.6460 will nudge risk/reward merits towards a cautious bullish punt.
JAN RBOB
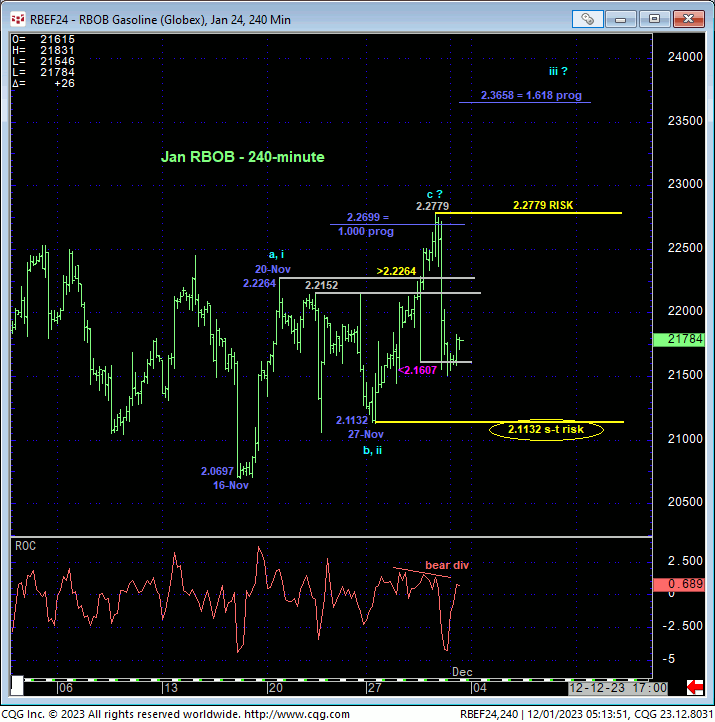
Here too, after busting out above last week’s 2.21/2.22-handle-area highs and resistance, the bull had every opportunity to perform. Failing miserably to sustain 2.21+ gains and confirming a countering bearish divergence in short-term mo below a minor corrective low from Wed at 2.1607, this market left yesterday’s 2.2779 high in its wake as the prospective end to a textbook 3-wave recovery from 16-Nov’s 2.0697 low as labeled in the 240-min chart below. Left unaltered by a recovery above 2.2779, this 3-wave bounce may be considered a corrective/consolidative event that now warns of a resumption of Sep-Nov’s downtrend that preceded it.
This said, a break of 27-Nov’s 2.1132 low remains required to confirm this second-half of Nov recovery as a correction and re-expose the broader bear. Per such, we believe this market has identified 2.113 and 2.2779 as the key directional flexion points heading forward and the key risk parameters commensurate with one’s personal risk profile.
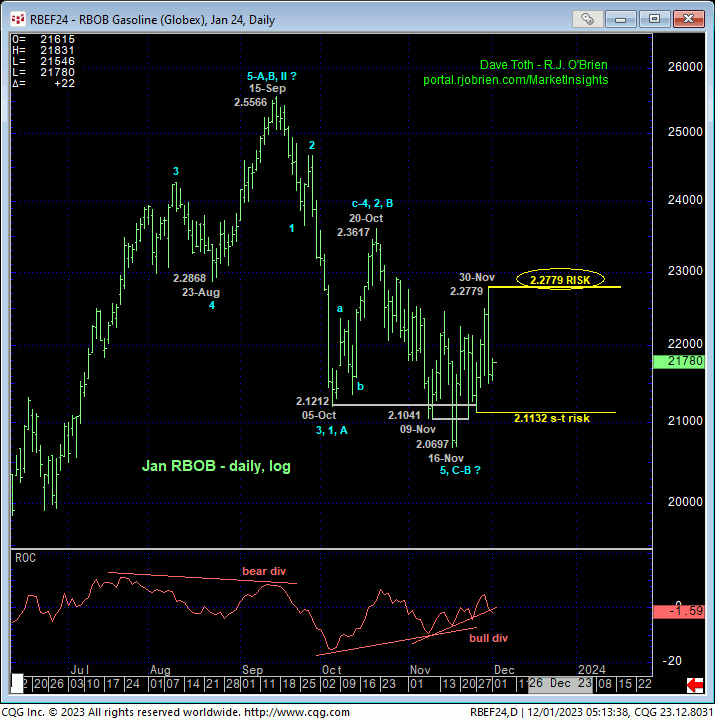
On a broader daily scale, we’ve decided to trail our longer-term bear risk parameter to yesterday’s 2.2779 high due the recent jump in historical volatility and the fact that there are NO levels of any technical merit between that high and 20-Octc’s 2.3617 high. And until negated by a relapse below 2.1132, Wed’s bullish divergence in daily momentum remains in effect.
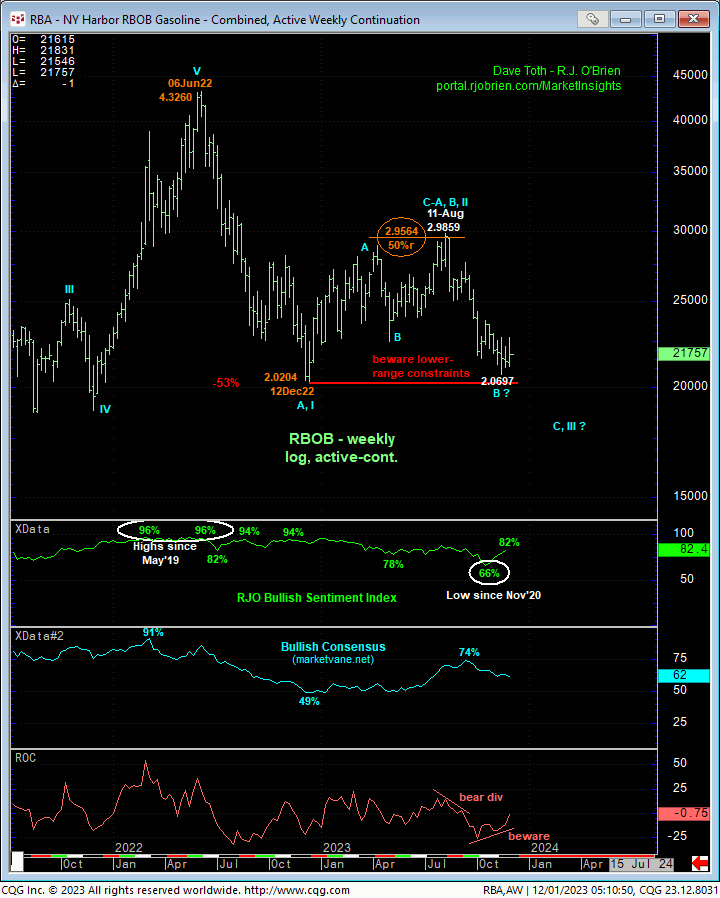
Moving out even further to a weekly log active-continuation basis, the market’s obvious proximity to the extreme lower recesses of this year’s range and key support cannot be ignored. The prospects of another intra-range rebound are easy to see. HOWEVER, it’s interesting but odd to note that our RJO Bullish Sentiment Index has RISEN over the past five weeks into the teeth of Oct-Nov’s resumption of the broader decline from Aug and Sep highs. This means the Managed Money community is FADING this sell-off by buying into it, producing the highest level in our RJO BSI since that that warned of and contributed to Sep’s top and major reversal lower.
These opposing elements warn us to acknowledge and be flexible to a bigger move EITHER WAY, with the key directional flexion points being 2.1132 and 2.2779. Traders are advised to toggle directional biases and exposure around these two levels commensurate with their personal risk profiles. We will also keep a keen eye out for a bullish divergence in short-term momentum from a level above Mon’s 2.1132 low that might tip directional odds to the bull side and present a favorable risk/reward buying opportunity.
